


Ad spend efficiency directly affects how businesses manage their capital. Inefficient ad strategies waste significant resources - studies show 40% of digital ad budgets are wasted, which could mean $20,000 lost per month for a $50,000 budget. By improving efficiency, businesses can redirect funds to growth areas like inventory or product development.
Key insights include:
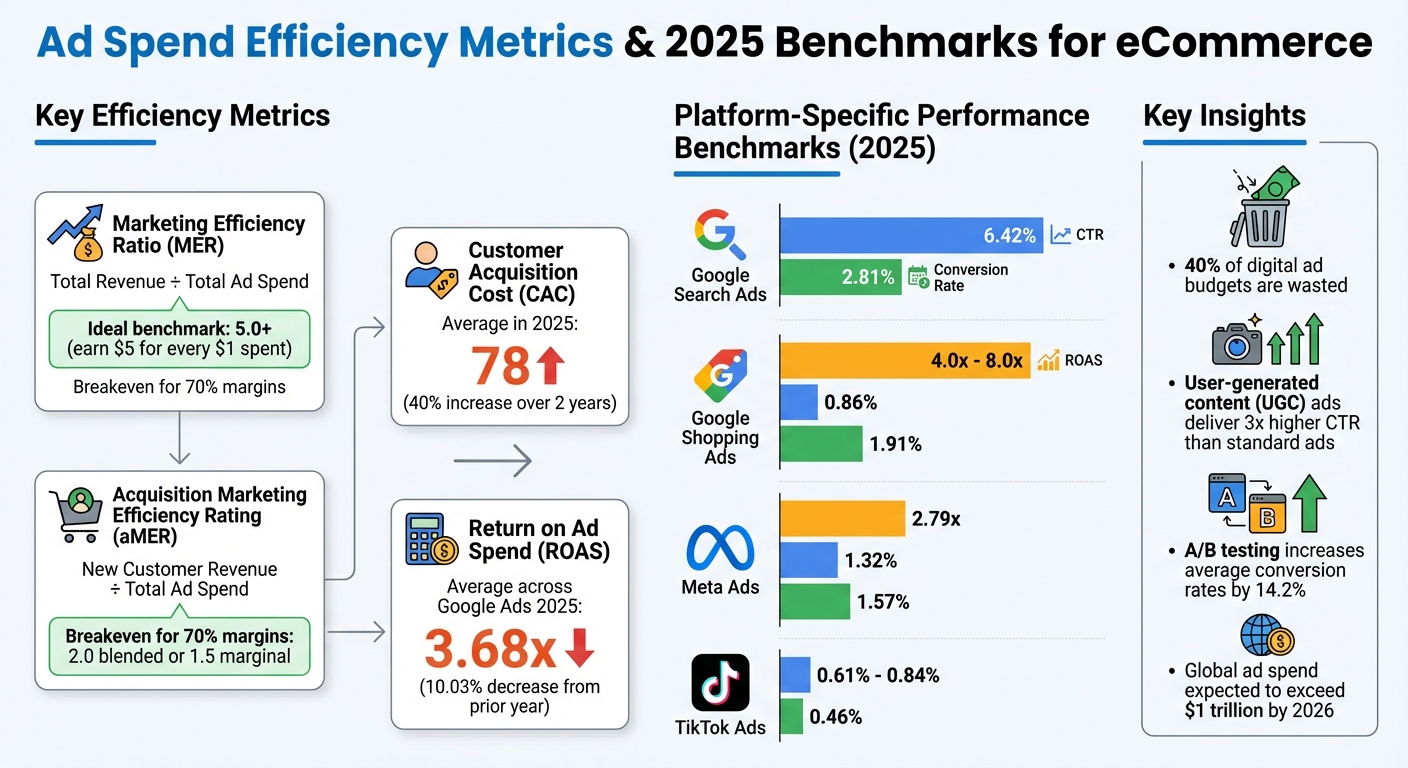
- Marketing Efficiency Ratio (MER): Measures total revenue per dollar spent. A MER of 5.0+ is ideal.
- Customer Acquisition Cost (CAC): Rising costs (e.g., $78 in 2025) demand careful comparison to Customer Lifetime Value (CLV).
- Performance Metrics: Metrics like ROAS, CTR, and conversion rates indicate ad effectiveness and areas for improvement.
Efficient ad spending allows businesses to scale while maintaining profitability. Tools like Onramp Funds provide fast, flexible financing to reinvest in high-performing campaigns, ensuring cash flow stays healthy while driving growth.
What Ad Spend Efficiency Means for eCommerce
What Is Ad Spend Efficiency?
Ad spend efficiency measures how much revenue your business generates for every dollar spent on advertising. The Marketing Efficiency Ratio (MER) is the go-to metric for this - it’s calculated by dividing Total Revenue by Total Ad Spend [1][7]. Think of it as a bird’s-eye view of how well your marketing dollars are working across your entire business [1][7].
Here’s a helpful benchmark: a MER of 5.0 or higher means you’re earning $5 for every $1 spent on marketing [7]. Another key metric is the Acquisition Marketing Efficiency Rating (aMER), which focuses on new customer revenue. It’s calculated by dividing new customer revenue by total ad spend [1]. For businesses with 70% gross margins, the breakeven point is usually around a 2.0 blended aMER or a 1.5 marginal aMER [1].
Why does MER matter more than metrics like ROAS? Privacy changes (like iOS 14.5) and fragmented customer journeys have created gaps in attribution, making platform-specific metrics less reliable [7][8]. MER, however, captures the bigger picture, including indirect benefits like increased organic search traffic or email conversions - what’s often called the "halo effect" [7].
This top-level insight is critical for deciding how to allocate your ad budget to fuel eCommerce growth.
How Ad Spending Drives eCommerce Growth
Ad budgets do more than just bring in traffic - they influence how efficiently your business uses its capital. By tracking marginal aMER (how well each additional dollar performs), you can identify the point where spending stops being profitable [1]. This prevents two costly mistakes: underspending, which leaves growth opportunities untapped, and overspending, which eats into your profits by surpassing the breakeven point.
A big part of this process is separating new customer revenue from repeat purchases driven by low-cost channels like email or SMS [1]. This distinction helps you understand your actual acquisition efficiency and reallocate budgets from underperforming campaigns to those that drive meaningful growth. As Lebesgue, a trusted source for advertising optimization with over 235,335 subscribers, explains:
"MER is not meant to replace all other metrics - it's meant to anchor them" [8].
sbb-itb-d7b5115
Ecommerce Marketing Efficiency Ratio And How To Use It
Metrics That Measure Ad Performance
Return on Ad Spend (ROAS)
ROAS measures how much revenue you earn for every dollar spent on advertising. It’s calculated by dividing your revenue by your ad spend[3][6]. For instance, if you spend $5,000 on ads and generate $15,000 in revenue, your ROAS would be 3.0x.
In 2025, the average ROAS across Google Ads was 3.68x, reflecting a 10.03% decrease from the prior year[2]. Google Shopping ads generally deliver a ROAS between 4.0x and 8.0x, while Meta ads average around 2.79x[2]. These benchmarks can help you determine whether your campaigns are performing well compared to industry standards.
Tracking ROAS by channel and campaign is critical. A high ROAS typically indicates strong profitability, but it’s essential to consider your gross margins. Even with a high ROAS, thin margins can undermine overall profitability. For a broader perspective, it’s also helpful to examine spending efficiency through metrics like Customer Acquisition Cost.
Customer Acquisition Cost (CAC)
CAC reflects the cost of acquiring a new customer. By 2025, the average eCommerce CAC reached $78 across all categories, marking a 40% increase over the previous two years[2]. To determine whether your spending is sustainable, compare your CAC to your Customer Lifetime Value (CLV), which estimates the total revenue a customer generates over their relationship with your brand. If your CAC is significantly higher than your CLV, it may indicate that your margins are too tight to sustain growth.
Balancing CAC and CLV is essential for deciding when to scale your campaigns or make adjustments to improve efficiency.
Click-Through Rate (CTR) and Conversion Rate
Engagement metrics like CTR and conversion rate provide deeper insights into your campaign's effectiveness. CTR measures the percentage of users who click on your ad after seeing it, while the conversion rate tracks the percentage of those clicks that result in a sale[2][4]. Together, they reveal how well your ads attract attention and drive action.
For example, Google Search ads average a 6.42% CTR and a 2.81% conversion rate. Google Shopping ads, on the other hand, see a 0.86% CTR and a 1.91% conversion rate[2]. Meta ads average a 1.32% CTR and a 1.57% conversion rate, while TikTok ads typically achieve a CTR between 0.61% and 0.84%, with a 0.46% conversion rate[2][4].
If your CTR is low, it might mean your targeting or creative isn’t resonating with your audience. Similarly, a low conversion rate could signal issues like a complicated checkout process or a mismatch between your ad’s message and the landing page. Interestingly, user-generated content (UGC) ads tend to deliver CTRs that are three times higher than standard ads, making them an effective way to boost performance[4].
Finding and Eliminating Wasted Ad Spend
How to Identify Underperforming Campaigns
Did you know that more than 40% of digital ad spend is wasted due to poor strategies and limited data insights [5]? This waste often stems from relying on blended metrics, which obscure the marginal return on each additional dollar spent. Dave Rekuc, VP of Marketing at 4x400, frames the issue perfectly:
"When does my next dollar of advertising stop making me money?" [1]
To uncover inefficiencies, compare revenue generated when spending $1,000 versus $1,500 per day. This will help pinpoint whether you're spending beyond the marginal breakeven point - where extra dollars fail to deliver value [1]. Relying too heavily on platform reports can lead to over-attribution of conversions, further masking inefficiencies [5].
Another culprit? Creative fatigue. Ads lose their effectiveness over time, and underperforming creatives can drag down overall performance. Regularly analyze your assets to identify what’s no longer working. A/B testing is your best friend here. By continuously testing targeting, bidding strategies, and creative elements, you can spot weaknesses and make improvements. In fact, consistent testing has been shown to increase average conversion rates by 14.2% [3].
Once you've identified campaigns that aren't pulling their weight, it’s time to reallocate your budget to areas with stronger potential.
Moving Budget to Top-Performing Channels
Shifting your budget to high-performing channels can transform your advertising strategy. Take BK Beauty, for example. The brand embraced TikTok Shop in 2024, initially seeing a 10–20% sales boost. But when a makeup artist’s video went viral, sales skyrocketed by 30%. By pairing paid ads with TikTok’s affiliate program, they expanded their reach significantly [4].
However, don’t be too quick to cut campaigns that seem underwhelming. Some contribute indirectly to conversions through multi-touch attribution [5]. Before reallocating funds, address potential issues like weak landing pages or mismatched messaging, which can make a channel appear less effective. Tools like multi-touch attribution and media mix modeling can help validate campaign performance and ensure you’re making data-backed decisions [5].
Connecting Ad Efficiency with Onramp Funds Capital Planning
When it comes to maximizing ad performance, combining smart financing with data-driven decisions can elevate your capital strategy.
Scaling Marketing with Onramp Funds
Even the best-performing campaigns can hit a wall if cash flow becomes an issue. Let’s say you’re running a campaign with a 6:1 ROAS - it’s tempting to scale, but without enough cash on hand, you risk jeopardizing inventory or payroll. That’s where revenue-based financing steps in to bridge the gap.
Onramp Funds provides funding based on your sales data, skipping the lengthy credit check process. Instead of waiting weeks for approval, you can access funds within 24 hours and reinvest them into your highest-performing ad channels. For example, if your Facebook ads deliver a 5:1 ROAS, you could secure $100,000 to triple your ad spend without dipping into your operating cash [10].
What sets this model apart is its flexibility. Repayments are tied to your revenue - typically 5-10% of monthly sales - so you avoid the strain of fixed payments. Consider this: A DTC apparel brand with $2M in annual revenue used $150,000 from Onramp Funds to scale their TikTok ads from $20,000 to $80,000 per month. The results? A 40% revenue increase in three months, a 25% drop in customer acquisition costs to $35, and steady cash flow thanks to revenue-adjusted repayments [9][10].
This kind of financing empowers you to leverage ad performance data for smarter, faster decisions.
Using Ad Performance Data for Financial Decisions
Ad metrics aren’t just for evaluating campaigns - they’re powerful financial tools. Metrics like ROAS, CAC, and conversion rates from the past 90 days can help you predict revenue growth when scaling successful campaigns. Onramp Funds advises setting clear benchmarks: for instance, focus only on channels with a CAC under $50 and a CTR above 2% [11].
Here’s how to make it actionable: Export your last 90 days of ad data from platforms like Facebook Ads Manager or Google Analytics. Then, integrate your Shopify or Amazon store with Onramp’s dashboard to sync real-time sales data. This setup not only streamlines funding approval but also helps monitor how scaling affects efficiency. If your ROAS dips below a target like 3:1, you can quickly redirect funds to protect your capital [10][12].
This approach ensures that your financing aligns with ad performance. Businesses using revenue-based financing through Onramp Funds report cutting CAC by an average of 18% by focusing on high-CTR channels, and 70% of clients see improved cash flow in just 60 days [9][11].
Examples of Ad Efficiency Improving Capital Management
Example: Improving Cash Flow Through Better Ad Spending
In October 2025, Omnilux made a game-changing adjustment to its advertising strategy by using Northbeam's "Clicks + Deterministic Views" attribution model on Pinterest. This approach uncovered Pinterest's previously underestimated impact on customer conversions. With this new insight, Omnilux shifted its budget toward Pinterest, leading to an impressive 659% increase in ROAS[5]. This not only maximized the return on their ad spend but also freed up cash to invest in more impactful marketing initiatives.
By identifying which ad dollars drive revenue, businesses can reallocate budgets more effectively, improving cash flow. This kind of strategic money management creates opportunities to use flexible financing options to fuel even greater growth.
Financing Marketing Campaigns with Onramp Funds
Reallocating ad budgets is just the start - combining this with financing can amplify results. BK Beauty offers a great example. In May 2025, after launching its TikTok Shop, the brand saw a 10%–20% sales boost. Then, a makeup artist's video went viral through TikTok's affiliate program, creating an urgent need for additional capital to scale their paid ad efforts. BK Beauty turned to revenue-based funding to quickly ramp up their TikTok ads. This move paid off, driving sales up by 30%[5].
What makes this financing approach stand out is its flexibility. Payments adjust based on revenue, so businesses aren’t stuck with fixed costs during slower periods. Plus, funding can be secured in as little as 24 hours, allowing for immediate reinvestment in high-performing campaigns. This example highlights how optimizing ad spend and leveraging fast, adaptable funding can strengthen capital management strategies.
Conclusion
Making every advertising dollar work harder is key to driving growth. By tracking essential metrics, eliminating wasted spending, and reallocating budgets to the most effective channels, businesses can make smarter financial decisions. Instead of relying on blended averages, focusing on marginal returns helps pinpoint the exact moment when additional ad spend stops being profitable.
This refined strategy doesn’t just increase revenue - it reshapes financial planning. The link between ad performance and capital management becomes even more impactful when paired with flexible funding solutions. Take BK Beauty as an example: by combining optimized ad strategies with revenue-based financing, they unlocked growth opportunities that might have otherwise been out of reach. With global advertising spend expected to exceed $1 trillion by 2026[2], businesses that master this balance will gain a strong edge over competitors.
Onramp Funds provides a practical tool for eCommerce businesses aiming to close this gap. Offering funding in as little as 24 hours, with repayments tied to actual monthly sales, Onramp enables investments in top-performing campaigns. This flexible repayment model is particularly useful given that customer acquisition costs have risen nearly 40% over the past two years[2]. Allocating capital efficiently has never been more critical.
The most successful eCommerce brands align their ad spend efficiency with a solid capital strategy. By integrating advertising performance data into broader financial planning - and using funding options that adapt to revenue cycles - businesses can scale confidently while maintaining cash flow. Whether exploring new platforms like TikTok or doubling down on proven channels, having the right financial plan is essential. Blending ad spend strategies with flexible financing empowers eCommerce businesses to thrive in today’s competitive market.
FAQs
How do I find my marginal breakeven ad spend?
To figure out your marginal breakeven ad spend, you need to calculate the minimum revenue required to cover your costs. Start by identifying your profit margin. For example, if you make a $25 profit on a $100 sale, your profit margin would be 25%.
Next, use this formula: Break-Even ROAS = 1 ÷ Profit Margin Percentage. Once you have this number, multiply it by your target revenue. This ensures your ad spend stays in line with your profitability goals and helps you avoid running at a loss.
What MER target should I use for my margins?
A typical Marketing Efficiency Ratio (MER) target is 2:1, meaning you aim to generate $2 in revenue for every $1 spent on marketing. That said, this benchmark can shift depending on your profit margins and how your results compare to platform standards. It's essential to align your MER goals with your business objectives and overall financial strategy.
When does revenue-based financing make sense for scaling ads?
Revenue-based financing works perfectly for scaling ad campaigns because it ties your ad budget directly to your revenue performance. This approach adjusts your marketing spend based on your sales - allowing you to ramp up during periods of growth and pull back when things slow down. It’s a great fit for businesses in fast-changing markets, as it keeps ad spending manageable while adapting to seasonal trends or shifts in campaign performance.
Related Blog Posts
Onramp Funds
Funding built around your sales
Connect your store and see what you qualify for. Repay as a percentage of sales, with no personal credit check.
Funding in as little as 24 hours.
