
Inventory turnover measures how often you sell and replenish your stock within a specific period. It’s a key metric for understanding how efficiently your business uses capital. A higher turnover rate means faster cash flow and lower storage costs, while a slower rate ties up money in unsold inventory, limiting growth opportunities.
Key Points:
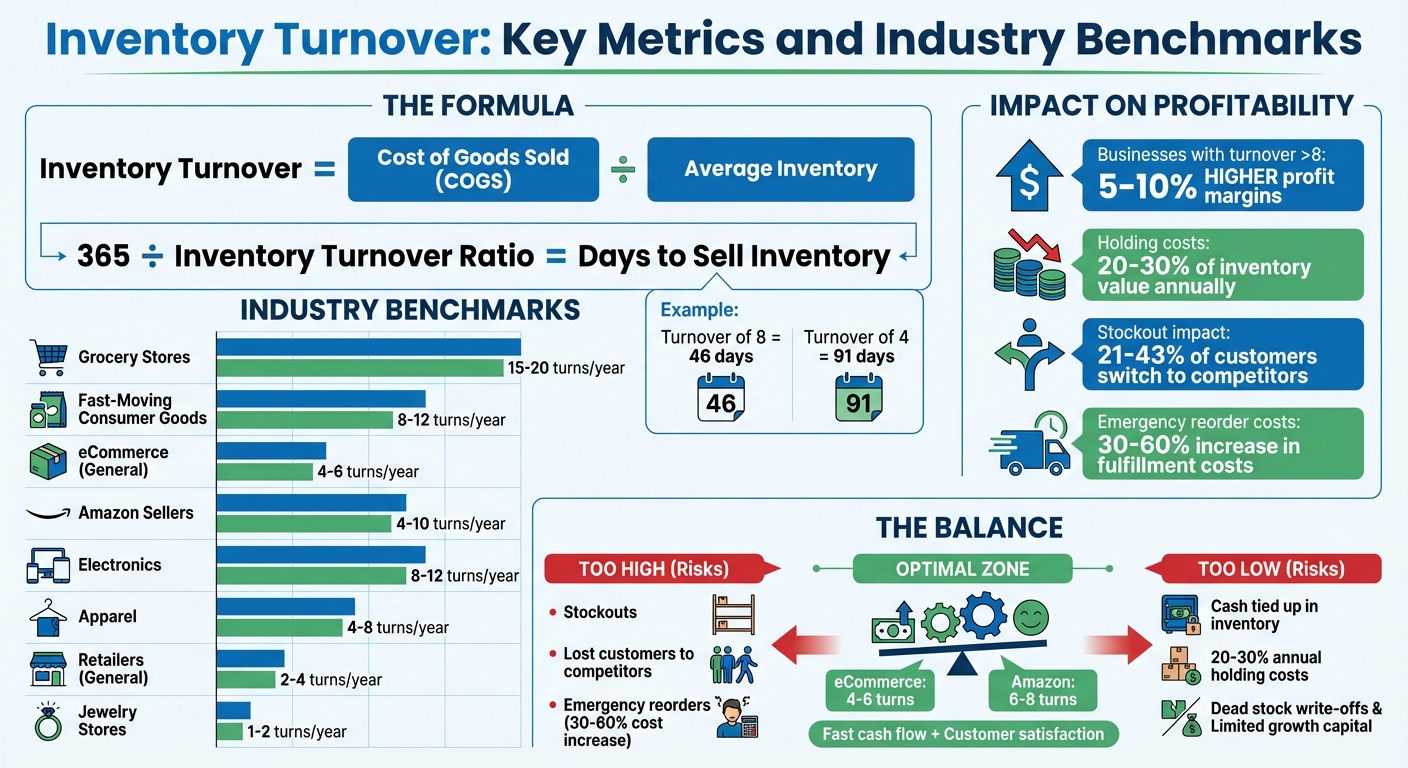
- Formula: Inventory Turnover = Cost of Goods Sold (COGS) ÷ Average Inventory.
- Efficiency Impact: Faster turnover frees up cash for marketing, product development, and scaling.
- Risks of Imbalance:
- High turnover risks stockouts, driving customers to competitors.
- Low turnover increases holding costs and risks outdated inventory.
- Industry Benchmarks:
- Grocery stores: 15–20 turns/year.
- eCommerce: 4–6 turns/year.
- Amazon sellers: 4–10 turns/year.
Improving Turnover:
- Forecast Demand: Use data to align inventory with sales trends.
- Just-in-Time Inventory: Reduce storage costs by ordering smaller, frequent shipments.
- Analyze SKUs: Identify slow movers and optimize inventory decisions.
Efficient inventory turnover keeps your cash cycle healthy and your business growing. Aim for a balance that minimizes costs without sacrificing customer satisfaction.
Inventory Turnover Benchmarks by Industry and Impact on Profit Margins
What Inventory Turnover Means for Your Business
Defining Inventory Turnover
Inventory turnover shows how often a company sells and replaces its stock within a set timeframe, typically over a fiscal year [1][5]. Picture it as a gauge for your inventory's movement - are your products selling quickly, or are they gathering dust in storage?
This metric is a key indicator of how efficiently your business uses its inventory to drive revenue [1][7]. For example, a turnover rate of 6 means your entire inventory is sold and replenished six times in a year, while a rate of 2 suggests a slower pace. Essentially, it reflects how quickly your products move and how that impacts your overall asset management. Grasping this concept is essential for understanding how inventory turnover ties into your business's financial health.
How Inventory Turnover Measures Capital Efficiency
Now, let’s connect inventory turnover to capital efficiency. A faster turnover rate means less money tied up in unsold products, freeing up cash for other business needs [6][2]. Each time you sell through your inventory, those goods are converted into cash, which can then be reinvested into areas like marketing, new product development, or operational upgrades. As Warren Brown, Head of Product at Settle, puts it:
"Inventory turnover is a key lever for managing cash flow, improving operational efficiency, and supporting frictionless growth." [6]
A higher turnover rate also trims down holding costs, which include expenses like warehouse fees, insurance, and handling [9][2]. Studies indicate that holding costs can eat up 20% to 30% of your inventory value annually [9]. By moving inventory faster, you shorten the time you’re paying these costs, which is a smart way to improve cash flow and reinvestment opportunities.
However, it’s important to strike a balance. While high turnover is generally good, an overly aggressive rate can lead to stockouts, which could push 21% to 43% of customers toward competitors [1][2][8]. On the other hand, slow turnover locks up capital and increases the risk of unsold inventory. Businesses with turnover rates above 8 often enjoy 5% to 10% higher profit margins compared to those with slower rates [9]. Finding the right turnover rate is critical for maintaining both efficiency and customer satisfaction.
sbb-itb-d7b5115
How to Calculate Inventory Turnover
The Basic Formula
The formula for inventory turnover is straightforward:
Inventory Turnover = Cost of Goods Sold (COGS) / Average Inventory
To find your average inventory, use this calculation:
(Beginning Inventory + Ending Inventory) / 2
This approach helps smooth out seasonal fluctuations.
It’s important to use COGS in the formula because inventory is valued at cost, not at the selling price. If you substitute revenue for COGS, the ratio becomes inflated since revenue includes profit margins. This creates a mismatch, making the comparison inaccurate. Sticking with COGS ensures both sides of the equation are measured consistently, providing a clearer picture of efficiency.
Also, be sure to match the time periods. For example, if you’re using annual COGS, pair it with the annual average inventory. Using a full year’s COGS with only one month’s inventory data will skew your results. For eCommerce businesses, which often deal with faster inventory cycles, tracking turnover monthly can offer more actionable insights, helping you adjust purchasing or marketing efforts more quickly.
Once you’ve calculated the turnover ratio, the next step is interpreting what it means for your business.
Reading Your Turnover Numbers
After calculating the ratio, translate it into practical insights.
You can convert the turnover ratio into inventory days using this formula:
365 / Inventory Turnover Ratio
This tells you the average number of days it takes to sell your inventory. For instance, a turnover ratio of 8 means it takes about 46 days to sell your stock, while a ratio of 4 suggests it takes roughly 91 days.
What qualifies as a "good" turnover ratio varies by industry. For example:
- Grocery stores and businesses dealing with perishables often achieve 15–20 turns annually.
- Jewelry stores, on the other hand, may only turn inventory 1–2 times a year [12].
- Most eCommerce businesses aim for a turnover between 4 and 6.
A real-world example is The Home Depot's performance in fiscal year 2020. With $72.7 billion in COGS and $14.5 billion in average inventory, they achieved a turnover ratio of 5.0, meaning they turned their inventory approximately every 73 days [13]. Fast-moving consumer goods often see annual turnover rates of 8–12 or more, while luxury or niche products with higher margins can sustain lower turnover rates [10].
Seasonality also plays a big role in interpreting these numbers. For instance, comparing Q4 holiday sales to Q2 summer months can lead to misleading conclusions. Instead, compare year-over-year data for the same quarter - like Q4 2025 versus Q4 2024 - to identify meaningful trends [10]. If you’re calculating quarterly turnover, multiply the result by four to align it with annual benchmarks [12].
How Inventory Turnover Affects Cash Flow and Profits
The Link Between Turnover and Cash Flow
When inventory moves quickly, cash returns to your business faster, improving liquidity. This means you can reinvest that cash into areas like marketing campaigns or new product launches. On the flip side, slow turnover ties up capital in unsold inventory, limiting your ability to use those funds elsewhere [3][9].
Quick turnover also helps cut down on operating expenses. Lower storage fees, reduced insurance costs, and less labor for inventory management are some of the benefits. For example, Amazon sellers face specific challenges: items stored for over 181 days can rack up aged inventory surcharges, and products held for more than a year may incur long-term storage fees of up to $6.90 per cubic foot [4].
"Having cash locked in the wrong inventory isn't just inconvenient, it can stall growth." - Warren Brown, Head of Product, Settle [6]
Because of these cash flow dynamics, keeping a close eye on turnover rates is essential for maintaining profitability.
Finding the Right Balance
While faster turnover improves liquidity, there’s a fine line to walk. Too fast, and you risk stockouts - leaving customers empty-handed and pushing them toward competitors. Stockouts can also lead to expensive emergency reorders, which may increase fulfillment costs by 30–60% due to expedited shipping [2].
On the other hand, slow turnover can drain your profits. Holding inventory for too long ties up capital and adds to storage costs, which can eat up 20–30% of a product's value annually [9]. Even worse, unsold items sitting for six months or more may become dead stock, forcing you to write off inventory and take a direct hit to your bottom line [1][3].
The "ideal" turnover ratio varies depending on your business and product type. Retailers often aim for a ratio between 2 and 4, while Amazon sellers typically target 4 to 10. For instance, electronics might see 8–12 turns per year, while apparel tends to average 4–8 [4]. Businesses achieving turnover rates above 8 often report 5–10% higher profit margins [9]. However, chasing high turnover only makes sense if your supply chain can handle the demand without frequent stockouts.
For businesses using revenue-based financing, maintaining the right turnover rate becomes even more crucial. Efficient inventory management ensures steady cash flow, enabling you to manage flexible repayment schedules while continuing to fund growth opportunities.
Why Does Inventory Turnover Affect Working Capital? - Smart Logistics Network
Ways to Improve Your Inventory Turnover
Improving inventory turnover can accelerate cash flow and make better use of your capital. Here are three practical strategies to help you achieve this.
Better Demand Forecasting and Planning
Accurate demand forecasting plays a huge role in keeping your inventory in sync with actual sales. Misaligned inventory can tie up cash unnecessarily - just look at how the fashion industry carried excess stock worth between $70 billion and $140 billion in 2023 [16].
Start by segmenting your SKUs into fast, medium, and slow movers using ABC analysis. For fast-moving products, set clear reorder points and maintain sufficient safety stock, especially during promotional periods. On the other hand, for slower-moving items, reduce order quantities and switch to smaller, more frequent restocking [5].
"The more accurate your forecasting, the better your inventory flows." – Yash Bodane, Senior Product & Content Manager, Webgility [16]
To refine your forecasts, integrate sales and inventory data across all channels while accounting for factors like returns, promotions, and shifts in demand. This holistic approach can help some companies achieve inventory turnovers that are 2 to 9 times higher than their industry average [11].
Pair these forecasting improvements with efficient replenishment strategies to keep your inventory moving smoothly.
Using Just-in-Time Inventory Methods
The Just-in-Time (JIT) approach reduces the time products sit on shelves, freeing up working capital and cutting storage costs [15]. Companies like Zara and H&M excel at this, taking products from design to store shelves in just three weeks [11].
But running a lean inventory has its risks. To make it work, collaborate with suppliers to lower minimum order quantities (MOQs) and increase delivery frequency. Automated replenishment systems can also help by triggering restocks based on pre-set thresholds, avoiding last-minute scrambling [6]. Keep a close eye on both inventory turnover and stockout rates to ensure you're not sacrificing customer satisfaction for efficiency [5].
Once your system-level processes are optimized, focus on individual product performance to further improve turnover.
Tracking Turnover by Product
Regularly analyzing turnover rates at the SKU level can highlight which products are tying up capital and which are driving profits. Monthly reviews can help you avoid accumulating dead stock. When calculating turnover, use the cost of goods sold (COGS) rather than total sales to get a clearer picture [11].
For slow-moving items, consider dynamic pricing strategies like clearance sales, bundling, or tiered discounts [14]. Redistribute excess inventory to locations with higher demand, or for new products, use preorder campaigns to test market interest before committing to large orders [14].
For most eCommerce businesses, aiming for an inventory turnover ratio between 4 and 6 strikes a good balance between sales speed and restocking efficiency [5].
Conclusion
Inventory turnover is a direct reflection of how effectively your capital is working to fuel growth. By mastering this metric, you can speed up cash flow, cut down on storage costs, and free up funds to invest in areas like marketing or product development.
Research shows that businesses with turnover rates above 8 often enjoy profit margins that are 5–10% higher than those with slower-moving inventory [9]. On the flip side, every extra day stock lingers on your shelves chips away at profitability through expenses like storage, insurance, and handling.
To stay ahead, segment your SKUs based on their sales velocity. This helps you decide which products deserve more investment and which might need to be liquidated. Monitor your turnover monthly, set up automated reorder points, and base your decisions on real sales data - not just intuition. Whether your goal is the 2–6 range that suits most eCommerce businesses [2] or the 6–8 range ideal for Amazon sellers [4], the trick lies in striking the right balance to maintain cash flow while avoiding stockouts.
The businesses that succeed see inventory turnover as a continuous process, not a one-time task. By consistently refining this metric, you ensure every dollar in your inventory works harder, driving growth and maximizing efficiency across your operations.
FAQs
What inventory turnover rate is considered good for my product category?
A healthy inventory turnover rate usually falls between 5 to 10 times per year, indicating that stock is being managed effectively - neither running out too often nor sitting idle for too long. That said, the "ideal" rate can vary significantly by industry. For example, grocery stores often see higher turnover rates due to perishable goods, while luxury items, which sell less frequently, might operate with lower rates. It's essential to consider both your product type and overall business model when analyzing your turnover rate.
How do I balance higher turnover with avoiding stockouts?
Balancing a high inventory turnover while avoiding stockouts requires a strategic approach. Start by using turnover data to establish dynamic reorder points that adjust based on real-time demand and lead times. This ensures you're replenishing stock at the right time.
Leverage historical sales data to forecast future needs accurately, and maintain safety stock as a cushion for unexpected spikes in demand. To focus your efforts, apply ABC analysis to identify and prioritize fast-moving items that contribute most to your sales.
For even better efficiency, integrate turnover data with your inventory systems. This allows for automation and alerts, ensuring optimal stock levels while reducing the risk of shortages.
Should I calculate turnover monthly or annually for my store?
To fully understand how efficiently your store is operating, it's important to calculate inventory turnover on both a monthly and annual basis. Annual calculations give you a bigger picture of your store's performance over time, while monthly calculations allow you to monitor short-term changes and quickly identify emerging trends.
