
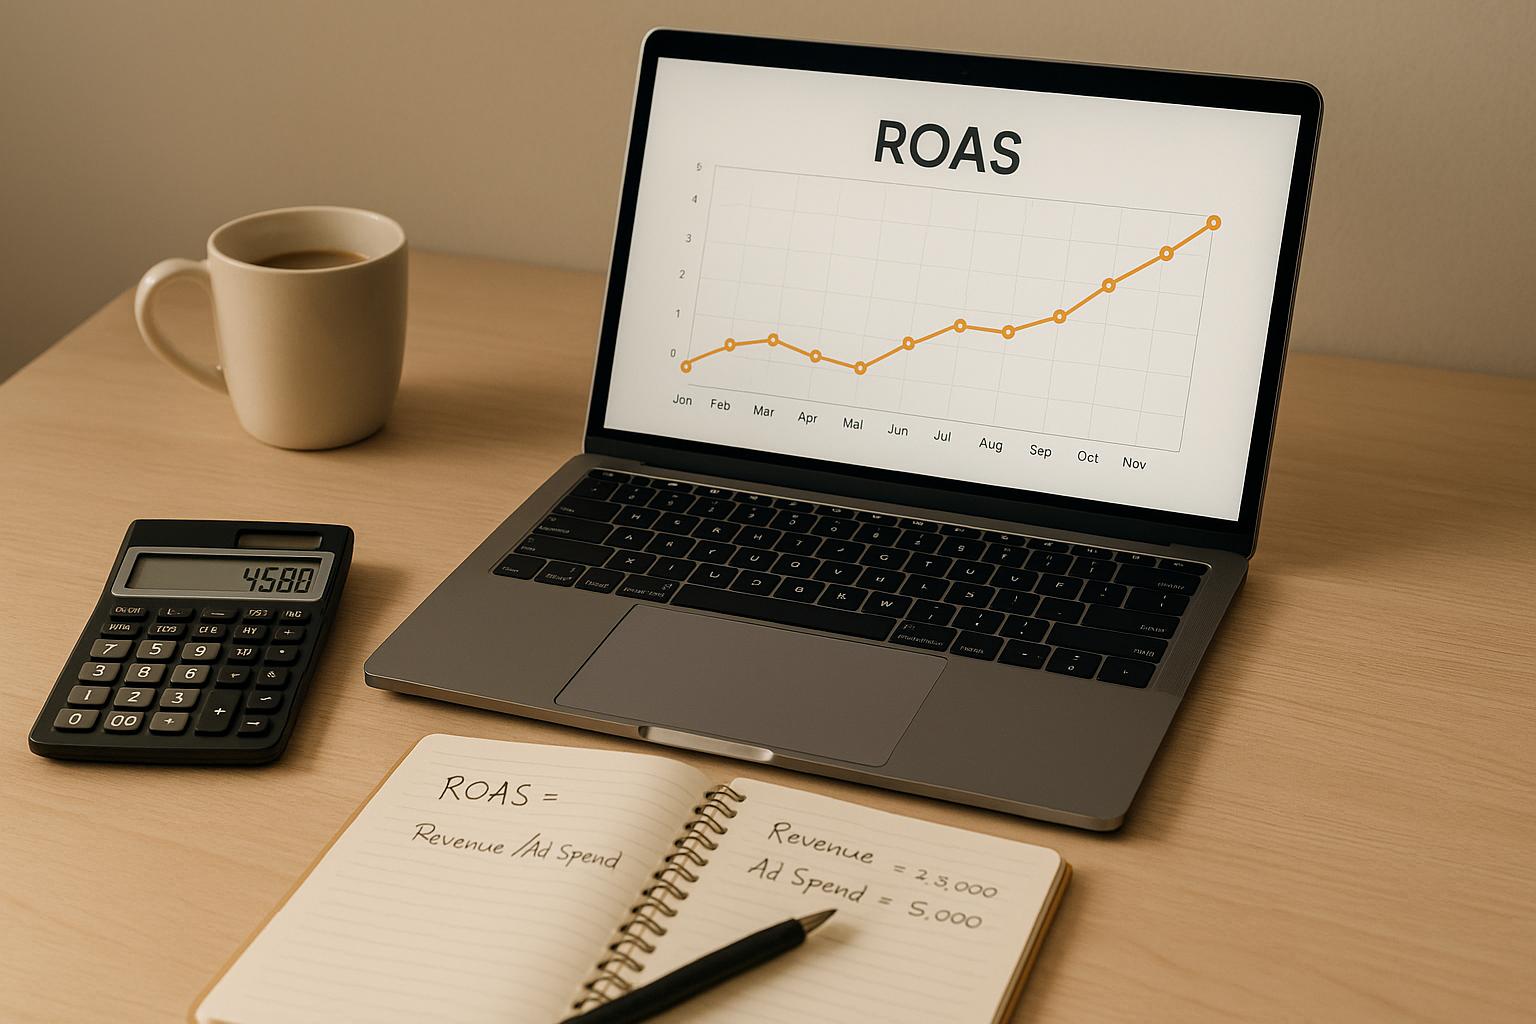
Return on Ad Spend (ROAS) is a simple formula to measure how much revenue your ads generate for every dollar spent. To calculate it:
ROAS = Revenue from Ads ÷ Cost of Ads
For example, if you spend $1,000 on ads and earn $4,000 in revenue, your ROAS is 4:1 (or 400%).
Key takeaways:
- Track ad revenue accurately: Use tools like Shopify Analytics, Facebook Ads Manager, or Google Analytics.
- Include all ad-related costs: Factor in ad spend, creative production, and platform fees.
- Understand breakeven ROAS: Calculate it using your profit margin (e.g., 1 ÷ 0.25 = 4:1 for a 25% margin).
ROAS helps you identify which campaigns are profitable and worth scaling. For most eCommerce businesses, a ROAS of 3:1 or 4:1 is a good benchmark. By analyzing metrics like conversion rate and average order value, you can improve performance and maximize returns.
The ROAS Formula Explained
What is ROAS?
ROAS, or Return on Ad Spend, measures how much revenue you earn for every dollar spent on advertising. For example, a ROAS of 4 means you’re generating $4 in revenue for every $1 invested in ads. For eCommerce businesses running campaigns on platforms like Facebook, Google, Amazon, or TikTok Shop, ROAS is a direct indicator of whether your advertising efforts are profitable. It’s a straightforward way to assess if your ad spend is paying off.
The Basic ROAS Formula
The formula for ROAS is simple: ROAS = Revenue from Ads ÷ Cost of Ads.
Revenue from ads includes all sales income generated from customers who clicked on your ads and completed a purchase. For instance, if your Shopify store spends $500 on a social media campaign and brings in $2,000 in revenue, your ROAS would be $2,000 ÷ $500 = 4 (or 400%).
However, the “Cost of Ads” isn’t just what you pay the ad platform. It also includes creative production costs and platform fees, but excludes broader business expenses like salaries or rent. For example, if you spend $800 on Facebook ads and $200 on creating ad content, your total ad cost would be $1,000.
To track these numbers accurately, use analytics tools like Shopify Analytics, Facebook Ads Manager, or Google Analytics. Many sellers also rely on UTM parameters or tracking pixels to connect ad clicks to sales. If you prefer spreadsheets, you can easily calculate ROAS in Google Sheets. Simply input your revenue in one column and ad costs in another, then use the formula =(Revenue Cell / Cost Cell) to calculate ROAS for each campaign.
Key Metrics for eCommerce ROAS
Three key metrics play a major role in calculating ROAS effectively: conversion rate, average order value (AOV), and ad-attributed revenue.
- Conversion rate shows the percentage of ad clicks that result in a sale.
- AOV reflects the average dollar amount per order, calculated as total revenue divided by the number of orders.
- Together, these metrics help determine your revenue: Revenue = Clicks × Conversion Rate × Average Order Value.
Here’s an example: Imagine you run a Facebook campaign for a clothing store that generates 10,000 clicks. If 2% of those clicks convert into sales and your AOV is $50, you’ll have 200 sales (10,000 × 0.02), bringing in $10,000 in revenue (200 × $50). If your ad spend was $1,000, your ROAS would be 10:1 - a strong return.
Understanding these metrics also helps you identify opportunities for improvement. For instance, increasing your AOV from $50 to $60 through upselling or product bundles can raise your ROAS without increasing your ad spend. By mastering these metrics, you can calculate ROAS with clarity and make smarter advertising decisions.
How To Calculate Breakeven ROAS In 01:46 minutes.
How to Calculate ROAS: Step-by-Step
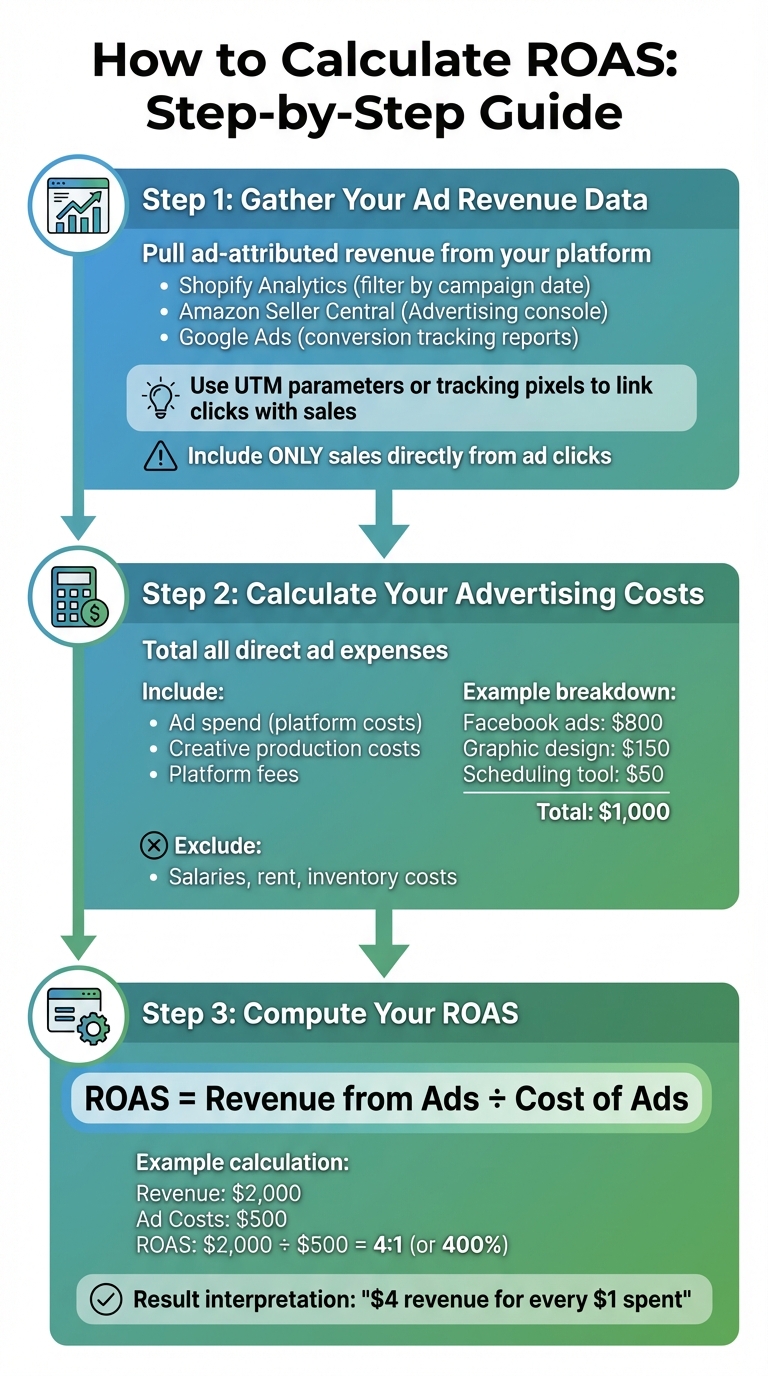
How to Calculate ROAS for eCommerce: 3-Step Process
Now that you know the ROAS formula, here's how to calculate it step by step.
Step 1: Gather Your Ad Revenue Data
Start by pulling ad-attributed revenue data from your eCommerce platform. If you're using Shopify, head to the analytics dashboard and filter sales by campaign date. Amazon sellers can access this information in their Seller Central account under the Advertising console. For Google Ads, check the conversion tracking reports to see revenue linked to ad clicks.
Make sure to include only sales directly generated by ad clicks. Use the appropriate attribution model, such as last-touch, to assign credit for sales. To ensure accuracy, cross-check your data using UTM parameters or tracking pixels to link clicks with sales. If you're selling on platforms like Walmart Marketplace, BigCommerce, or TikTok Shop, connect your store to their dashboards for detailed sales and performance data.
Step 2: Calculate Your Advertising Costs
Once you've confirmed your revenue, it's time to total up your ad costs. Include all direct expenses related to your campaign, such as ad spend, creative production costs, and platform fees.
For example, say you spent $800 on Facebook ads, $150 on graphic design for your ads, and $50 on a scheduling tool. Your total advertising cost would come to $1,000. To streamline this process, download ad spend reports from each platform and use a spreadsheet to sum up the numbers. A simple formula like =SUM(B2:B30) in Excel or Google Sheets works perfectly. Be sure to exclude unrelated costs like employee salaries or inventory expenses, as these aren't directly tied to the ad campaign.
Step 3: Compute Your ROAS
Finally, use the ROAS formula to calculate your return on ad spend: ROAS = Revenue from Ads ÷ Cost of Ads.
You can present the result as a ratio (e.g., 4:1, meaning $4 in revenue for every $1 spent) or as a percentage (e.g., 400%, by multiplying the ratio by 100).
For instance, if your revenue from ads is $2,000 and your total ad costs are $500, your ROAS would be $2,000 ÷ $500 = 4 (or 400%).
To make this process easier, you can automate it in Google Sheets or Excel. Set up columns for "Cost of Ads" (A2) and "Revenue from Ads" (B2), and calculate ROAS in cell C2 with the formula =B2/A2. For a percentage, use =(B2/A2)*100. You can extend this formula to analyze multiple campaigns at once.
ROAS Calculation Examples for eCommerce
Let’s break down two scenarios that show how ROAS can vary depending on the scale of your ad campaigns. These examples compare the results of a small test campaign against a larger, more aggressive ad push.
Example 1: Small Campaign
Picture this: you're a Shopify seller testing Facebook ads for a new apparel line. You spend $1,000 over one week, which includes creative costs. During that time, your campaign drives 200 sales with an average order value of $20, resulting in $4,000 in revenue.
Using the ROAS formula: $4,000 ÷ $1,000 = 4 (or 4:1, or 400%). In this case, every $1 spent on ads generates $4 in revenue. For a small campaign, especially one testing a new product or audience, a 4:1 ROAS is a strong indicator that your ads are connecting with the right customers and delivering profitable results without requiring a large upfront investment.
Example 2: Large Campaign
Now let’s scale things up. Imagine you're an Amazon seller running Google and Facebook ads to promote electronics. You allocate $50,000 per month, which includes both ad spend and creative costs. This campaign generates 3,000 orders with an average order value of $50, bringing in $150,000 in revenue.
Here’s the ROAS calculation: $150,000 ÷ $50,000 = 3, or a 3:1 ratio. This means every $1 spent returns $3 in revenue. While the ROAS here is lower than the smaller campaign, the total revenue and profit are significantly higher. At this scale, a 3:1 ROAS can still be very lucrative, provided your profit margins support it.
To better illustrate the comparison, here’s a quick side-by-side breakdown:
| Campaign Scale | Ad Spend | Revenue from Ads | ROAS (Multiple) | ROAS (Ratio) | Revenue per $1 Spent |
|---|---|---|---|---|---|
| Small Campaign | $1,000 | $4,000 | 4 | 4:1 | $4 |
| Large Campaign | $50,000 | $150,000 | 3 | 3:1 | $3 |
While the smaller campaign boasts a higher ROAS, it only brought in $4,000 in revenue. On the other hand, the larger campaign, with a slightly lower ROAS, generated $150,000. This kind of revenue can fund inventory expansion, scale marketing efforts, and drive long-term growth - assuming you have the cash flow to sustain it.
Up next, dive into breakeven ROAS and industry benchmarks to gain even deeper insights.
sbb-itb-d7b5115
Breakeven ROAS and Industry Benchmarks
How to Calculate Breakeven ROAS
Breakeven ROAS (Return on Ad Spend) is the point where your ad revenue perfectly offsets your costs, leaving you with zero profit or loss. The formula to determine this is straightforward:
Breakeven ROAS = 1 ÷ Profit Margin (using the decimal form of your profit margin) [1][4].
Let’s break it down with an example. Say you run a Shopify store with a 25% profit margin. Convert 25% into its decimal form, 0.25, and apply the formula:
1 ÷ 0.25 = 4.
This means you need a 4:1 ROAS - every $1.00 spent on ads must generate $4.00 in revenue just to break even.
Now, if your profit margin is higher, your breakeven ROAS will be lower. For example, with a 50% profit margin, the calculation is 1 ÷ 0.50 = 2, so you’d need $2.00 in revenue for every $1.00 spent on ads.
Once you know your breakeven ROAS, you can compare it to industry benchmarks to gain a clearer picture of your campaign’s profitability.
ROAS Benchmarks for eCommerce
After determining your breakeven ROAS, the next step is to evaluate how your campaigns stack up against industry benchmarks. For most physical goods sellers, a ROAS of 2:1 is cutting it too close to the breakeven point. Aiming for a ROAS of around 4:1 is generally considered a solid target for mid-margin products. On the other hand, high-margin or niche products often see ROAS levels of 10:1 or more, though such high performance can sometimes make scaling more challenging.
Here’s a quick summary of breakeven ROAS based on profit margins:
| Profit Margin | Breakeven ROAS |
|---|---|
| 20% | 5:1 |
| 25% | 4:1 |
| 30% | ~3.3:1 |
| 50% | 2:1 |
When calculating your profit margin, make sure to account for all variable costs, such as shipping, returns, platform fees, and fulfillment. Overlooking any of these expenses can distort your breakeven ROAS and lead to inaccurate profitability estimates [4][5]. Having a clear understanding of your true breakeven ROAS ensures you can make informed decisions about when to increase or scale back your ad spend [1][4].
Common Mistakes and How to Track ROAS Accurately
Common ROAS Calculation Errors
One of the biggest missteps in calculating ROAS is relying on gross revenue instead of net revenue. Let’s say you spend $5,000 on an ad campaign that generates $20,000 in gross sales. If $4,000 of those sales are refunded due to a 20% return rate, your actual ROAS drops from 4:1 to 3.2:1. That’s a 25% overestimation, which can lead to scaling campaigns that are barely breaking even - or worse, losing money [1].
Another common error is ignoring additional advertising costs. Many sellers focus only on direct media spend and overlook expenses like creative production, agency fees, or subscription costs for platforms. For instance, if you spend $1,000 on ads but also pay $200 for design work, your actual ad spend is $1,200. Calculating ROAS based on just $1,000 would show a misleading 5:1 ratio, when the real figure is 4.17:1. These discrepancies can heavily influence profitability decisions [2].
Attribution errors are another pitfall. Relying entirely on last-click attribution gives too much credit to retargeting ads while undervaluing awareness campaigns that initiate the customer journey. Single-touch attribution compounds this issue by assigning all credit for revenue to just one interaction, which distorts the real impact of your campaigns [3].
Addressing these errors requires more precise attribution methods.
Improving Tracking with Attribution Models
To avoid these pitfalls, consider adopting more advanced attribution models. A multi-touch attribution model offers a clearer picture by spreading credit across the entire customer journey rather than assigning it all to the last ad clicked. Tools like Google Analytics 4’s data-driven attribution are a great starting point for eCommerce businesses [3][4].
Testing is another key strategy. Use A/B testing to identify what’s working. For example, run two Facebook campaigns with different creatives. If one delivers a 5:1 ROAS and the other 4:1, you know which one to scale [1]. Pair this with UTM parameters on your ad links to track performance by campaign and ad set, giving you more granular insights [3][4].
For the most accurate tracking, consider implementing server-side conversion tracking alongside standard pixel tracking. This approach helps recover data lost due to iOS privacy updates and ad blockers, ensuring you capture a fuller picture of your actual conversions. Regularly reconcile data from platforms like Meta or Google Ads with your store’s back-end reports to catch and correct any discrepancies that could skew your ROAS calculations [3][4].
Scaling Ad Spend with Revenue-Based Financing
Flexible Financing for eCommerce Growth
Scaling ad spend requires capital, but many eCommerce sellers don’t have immediate access to the funds they need. Revenue-based financing (RBF) offers a solution by providing equity-free capital that’s repaid as a percentage of your sales. The best part? Repayments adjust automatically during slower months, making it a great option for businesses with fluctuating cash flow.
Onramp Funds specializes in RBF tailored for eCommerce sellers operating on platforms like Amazon, Shopify, BigCommerce, WooCommerce, Squarespace, Walmart Marketplace, and TikTok Shop. Funding can be accessed in under 24 hours, with repayments typically falling between 5% and 15% of your revenue. Over 3,000 eCommerce businesses have already benefited from this model, with an average revenue increase of 73% within 180 days of receiving funding [6].
"Applied, got our offer, and had cash in our bank account within 24 hours. Their Austin, TX based team was very professional and helped me deploy the cash to effectively grow our business." - Nick James, CEO Rockless Table [6]
This fast access to capital allows sellers to test new ad strategies and scale campaigns without giving up equity or committing to fixed payments. The major advantage? You retain 100% ownership of your business while gaining the funds needed to scale ads and invest in inventory [6].
Using Financing to Improve ROAS
Financing can have a direct impact on your Return on Ad Spend (ROAS). For example, a Shopify seller spending $5,000 per month at a 4:1 ROAS generates $20,000 in revenue. With $50,000 in RBF funding, increasing ad spend to $20,000 while maintaining the same 4:1 ROAS results in $80,000 in revenue. Even with an 8% revenue repayment (around $6,400), there’s still room for reinvestment and profit [6].
This type of funding also supports large-scale testing of ad creatives. Imagine allocating $10,000 to A/B test different campaigns on platforms like TikTok Shop or Facebook. By identifying which ads perform better - say, a 5:1 ROAS compared to 2:1 - you could lift your overall ROAS from 3:1 to 6:1. Without the extra capital, many sellers struggle to experiment and refine their strategies [6].
Before scaling, it’s crucial to calculate your breakeven ROAS (see the Breakeven ROAS section for details) to ensure that additional ad spend remains profitable. The flexible repayment system is another advantage - if a campaign doesn’t perform as expected, your repayments adjust based on revenue, giving you breathing room to optimize. This flexibility helps sellers fine-tune their ROAS and achieve sustainable growth [6].
Conclusion
Understanding and calculating ROAS is a must for any eCommerce seller aiming to allocate ad budgets wisely. The formula is straightforward - ad revenue divided by ad costs - and it gives you a clear snapshot of which campaigns are worth your investment and which ones are draining resources. Whether you're experimenting with a $500 ad test or managing a $20,000 monthly budget, ROAS provides the data you need to make informed decisions.
To make the most of this metric, ensure you're working with accurate revenue and cost data. Calculate your ROAS and compare it to your breakeven point (1 divided by your profit margin) to confirm your campaigns are hitting or exceeding the ideal 4:1 ratio. Be cautious of common pitfalls like overlooking certain ad-related costs or poor attribution, as these can create a false sense of success for campaigns that aren’t actually profitable.
Once you've identified campaigns that deliver strong returns, you can confidently scale your ad spend without worrying about cash flow. Services like Onramp Funds provide fast, equity-free capital with repayments tied to your sales, giving you the flexibility to grow. With a solid ROAS in hand, you can turn $1,000 into $4,000 or more in revenue, all while maintaining healthy cash flow.
FAQs
What can I do to improve my ROAS if my ad campaigns aren’t performing well?
If your ad campaigns aren’t delivering the results you’re hoping for, it’s time to go back to the basics. Start by revisiting your targeting and messaging - make sure they align with your audience’s interests and needs. Also, fine-tune your product listings with clear, compelling descriptions and high-quality images. These small tweaks can make a big difference in driving conversions.
Next, take a hard look at your ad spend. Cut back on low-performing ads and reallocate that budget toward channels or campaigns that are bringing in better results. Don’t be afraid to experiment with new ad creatives, formats, or audience segments. Sometimes, even small adjustments can uncover what works best for your audience.
Beyond ads, think about scaling your efforts. This could mean investing more in marketing or ensuring your inventory can keep up with demand. Flexible funding options, such as revenue-based financing, can give you the resources to grow without the need for equity or strict repayment terms. By refining your strategy and securing the right funding, you’ll be in a stronger position to improve your return on ad spend (ROAS).
What mistakes should I avoid when calculating ROAS for my eCommerce business?
To get an accurate ROAS calculation, steer clear of these frequent pitfalls:
- Relying on incomplete or outdated data: Make sure you're including all advertising expenses and sales figures, and verify that everything is current.
- Overlooking hidden expenses: Don't forget to account for costs like returns, discounts, and transaction fees, which can eat into your actual revenue.
- Disregarding time delays: Remember, ad spending doesn’t always translate to instant sales. Be mindful of the lag between when your campaigns run and when purchases occur.
By tackling these challenges, you’ll have a clearer picture of your ROAS, helping you make smarter, data-driven decisions for your eCommerce strategy.
What is breakeven ROAS, and how does it influence my ad spend decisions?
Breakeven ROAS (Return on Ad Spend) represents the minimum return your advertising efforts must generate to cover costs without dipping into losses. When your ROAS exceeds this point, your ad spend starts to turn a profit. If it falls short, you're losing money.
Knowing your breakeven ROAS is crucial for making informed decisions about your ad budget. By prioritizing campaigns that consistently surpass this benchmark, you can boost profitability and steer clear of wasting money on ads that don’t deliver.
