

Want to grow your Amazon business? Start by tracking the right metrics.
Metrics like sales velocity, inventory turnover, profit margins, and customer feedback scores help you decide when to reinvest and scale. Here’s what to focus on:
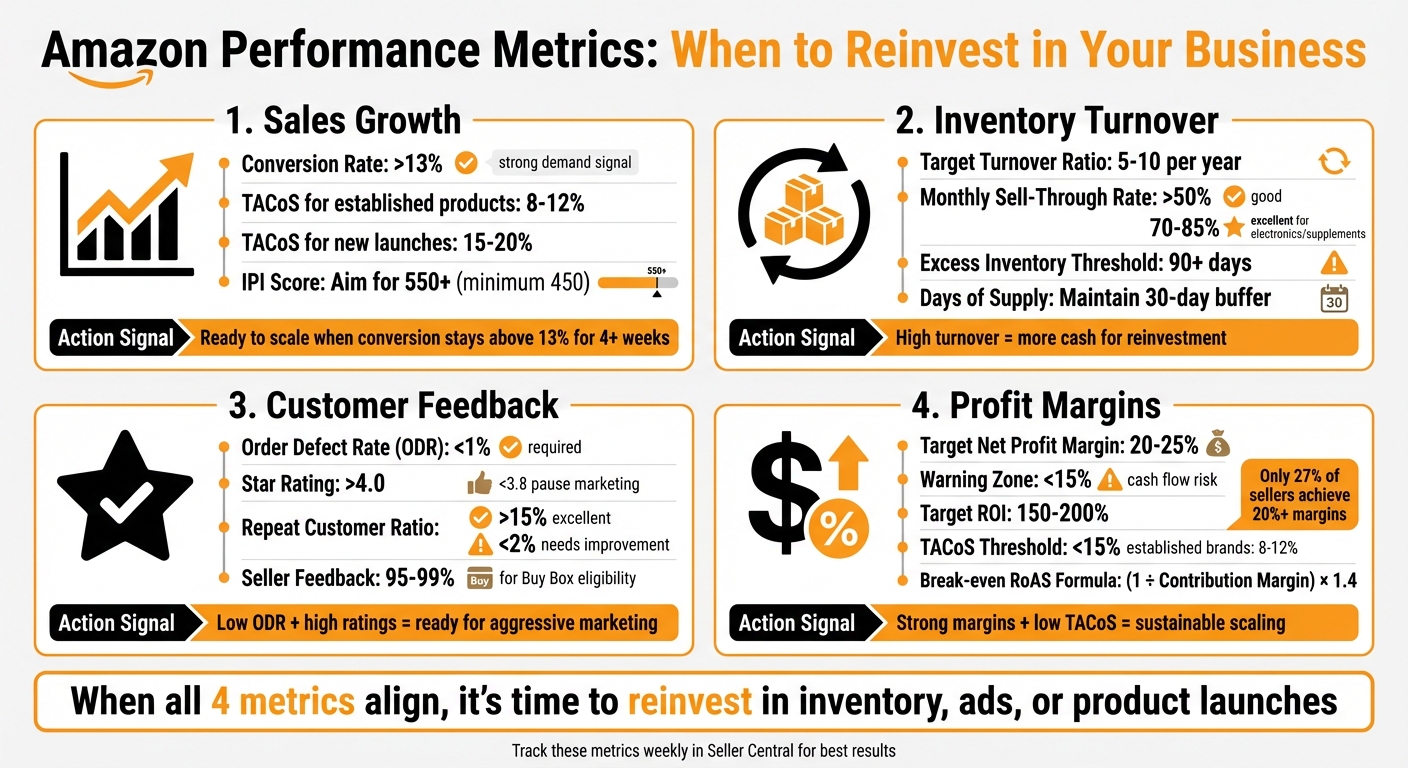
- Sales Growth: Consistent week-over-week sales increases and a conversion rate above 13% indicate demand.
- Inventory Turnover: Aim for a turnover ratio of 5–10 per year. High turnover frees up cash for reinvestment.
- Profit Margins: Target 20–25% net profit margins to ensure financial health before scaling.
- Customer Feedback: Keep Order Defect Rate (ODR) under 1% and ratings above 4.0 for better Buy Box eligibility.
When your metrics align, reinvesting in inventory, ads, or product launches can drive growth. Tools like Amazon’s Restock Inventory Tool and financing options like Onramp Funds make scaling faster and more efficient.
Key takeaway: Let your data guide decisions. Track performance, act quickly, and use flexible funding to seize growth opportunities.
Amazon Performance Metrics: When to Reinvest in Your Business
Sales Growth: When Your Numbers Show It's Time to Scale
Sales growth isn't just about boosting revenue - it’s about identifying consistent trends that show your business is ready to handle more inventory and marketing investment. Instead of focusing on monthly totals, keep an eye on week-over-week changes. This approach helps you differentiate between genuine growth and one-off spikes [4].
A conversion rate above 13% is a strong sign that your product listings are resonating with shoppers and converting them into buyers, indicating solid demand [4]. Additionally, established products with a Total Advertising Cost of Sales (TACoS) between 8% and 12% show efficient ad spend that supports profitable reinvestment. For new product launches, TACoS can fall between 15% and 20% during the early growth stages [4].
Another key metric is your Inventory Performance Index (IPI) score. While Amazon requires a score above 450 to avoid storage limits, aiming for 550 or higher ensures you have the capacity to stock up without restrictions as your business scales [4]. As CANOPY Management explains:
"The Buy Box isn't just about having the lowest price anymore. Amazon's algorithm considers your sales velocity, conversion rates, and overall account health." [4]
These metrics provide a clear foundation for tracking sales momentum and deciding when to reinvest.
How to Track Sales Velocity for Reinvestment Timing
To monitor sales velocity, start with the Business Reports in Seller Central. Use the "Detail Page Sales and Traffic" report to track Ordered Product Sales (OPS), units sold, and your Unit Session Percentage (conversion rate). Focus on week-over-week changes to identify early signs of momentum [4].
Analyzing rolling 4-week averages can help smooth out random fluctuations, making it easier to identify real demand trends. If your 4-week average consistently moves upward and your conversion rate remains above 10%, it’s a strong indication that growth is sustainable and reinvestment is warranted.
The Restock Inventory Tool in Seller Central is another valuable resource. It provides recommendations for replenishment quantities and shipping dates based on your sales history and demand forecasts [6][7]. To avoid stockouts, set automated reorder points to maintain a 30-day inventory buffer. Also, monitor your Days of Supply through the Inventory Health Report [7]. If this metric falls below 30 days - or below your supplier’s lead time - it’s time to reorder to maintain your rankings and avoid losing ground to competitors who stay in stock.
Separating Seasonal Spikes from Real Growth
Once you’ve established consistent sales patterns, it’s important to distinguish between short-term peaks and sustainable growth. Seasonal promotions or one-off events can create temporary surges, but true growth shows lasting momentum.
To validate genuine growth, compare week-over-week sales after promotions and review historical peak periods like Q4 or Prime Day [1][4]. Real growth is evident when sales remain elevated for 2–3 weeks after a promotional period.
Benchmarking against your category is equally important. For instance, if your sales jump 25% but the overall category grows by 30%, you might actually be losing market share despite higher revenue. Tools that analyze market trends can help you compare your growth rate to category norms [5][7]. Outperforming your category indicates a competitive edge that justifies scaling.
Lastly, keep an eye on your TACoS trends. If TACoS increases alongside sales, it could mean your growth is overly reliant on ad spend rather than organic demand. Sustainable growth is marked by a steady or declining TACoS, even as revenue rises.
sbb-itb-d7b5115
Inventory Turnover: Using Stock Efficiency to Free Up Capital
Inventory turnover shows how often you sell and replace your stock within a specific timeframe, usually a year. The formula is straightforward: Cost of Goods Sold (COGS) ÷ Average Inventory Value. To find the average inventory, add your starting and ending inventory, then divide by two[8]. For Amazon sellers, a turnover ratio between 5 and 10 per year is ideal. If you're in fast-moving categories like electronics or seasonal fashion, aim closer to 10[10]. A high turnover rate means quicker cash flow and the ability to reinvest in popular products. On the other hand, a low turnover rate suggests your capital is stuck in slow-moving inventory[8]. Pairing efficient turnover with a healthy Days of Supply helps maintain balanced stock levels. Additionally, monitoring the sell-through rate can sharpen your restock strategies.
The sell-through rate measures the percentage of inventory sold in a given period, often 30 days. The formula is (Units Sold ÷ Beginning Inventory) × 100[9]. A monthly sell-through rate above 50% is a solid benchmark. Categories like electronics and supplements often see rates between 70%–85%, while home goods typically range from 45% to 65%[5][9].
Fabricio Miranda, CEO and co-founder of Flieber, puts it simply:
"Retail is a money machine where you turn capital into inventory, and inventory into sales. The more times you run this machine, the more profit you generate."[9]
On the flip side, inventory sitting for over 90 days is considered excess and may require action to free up tied capital[11].
Finding Your Best-Sellers and Slow-Movers
To make smarter reinvestment decisions, dive into turnover metrics for individual SKUs. While your overall turnover might look healthy, it could be hiding underperforming products. Amazon's Seller Central Inventory Health Report is a great tool for spotting which SKUs are selling quickly and which have been idle for 90 days or more[7].
For best-sellers with sell-through rates above 80–85%, focus on faster replenishment and work with suppliers to cut lead times[5]. For slow-movers with sell-through rates under 30%, consider bundling, offering 15–25% discounts, or running targeted ads to clear them out before long-term storage fees kick in. Amazon charges extra for items held beyond 365 days, so moving stagnant inventory quickly is essential to protect your margins[10].
Dynamic pricing tools can also help adjust prices based on demand, ensuring slow-moving products are sold before they become a financial drain. By taking this SKU-level approach, you can free up capital from underperformers and reinvest it in top-performing products that drive growth.
Customer Feedback Scores: Building a Foundation for Growth
Customer feedback goes beyond just gauging satisfaction - it lays the groundwork for smart reinvestment strategies that fuel growth.
Start by keeping a close eye on your Order Defect Rate (ODR). An ODR below 1% is essential for maintaining operational stability and staying eligible for the Buy Box [12][13][15]. Since ODR is calculated using negative feedback (1- or 2-star ratings), A-to-Z Guarantee claims, and credit card chargebacks over a 60-day period [15], it’s crucial to check your Account Health Dashboard daily. This helps you spot and address issues quickly before they escalate.
A low ODR - under 1% - signals that your operations are running smoothly, making it a good time to consider reinvesting in areas like aggressive marketing, pay-per-click campaigns, or expanding inventory [13][14]. If your ODR starts rising, shift your focus to operational fixes. For example, if damaged goods are driving up your ODR, consider upgrading your packaging or logistics. If A-to-Z Guarantee claims are the issue, investing in customer service tools or hiring virtual assistants to meet Amazon's 24-hour response requirement can make a big difference [12][15].
While ODR is a key performance metric, star ratings are equally critical for building trust and driving sales. Keeping your ratings above 4.0 can significantly boost conversions, as 67% of consumers read at least six reviews before trusting a seller [18]. On the flip side, if your ratings drop below 3.8, it’s wise to pause marketing efforts and focus on improving your product [17][18]. Katy Luxem, an eCommerce Specialist at eCommerce Nurse, explains:
"Maintaining high performance levels not only enhances customer trust but also qualifies you for programs like Amazon Prime or Buy Box eligibility... resulting in potential sales growth." [1]
Your repeat customer ratio is another important indicator of long-term growth potential. A ratio above 15% suggests you’ve built a loyal customer base, making it a good time to invest in marketing or subscription programs like Subscribe and Save [17]. However, if your repeat customer rate is below 2%, it’s a sign to focus on improving product quality and customer experience before increasing ad spend. Strong feedback scores also improve your conversion rate, ensuring you get more value from every marketing dollar [17][18].
Don’t overlook negative feedback - it’s a goldmine for identifying areas to improve. If customers report mismatched descriptions, invest in professional photography and more accurate listings [13][15]. Consistently maintaining seller feedback between 95% and 99% is also vital for securing the Buy Box, especially in competitive categories [16].
Profit Margins: Confirming Financial Health Before Scaling
While customer feedback and inventory data can highlight operational readiness, profit margins are the real test of financial health when considering scaling. To maintain sustainable growth, aim for a net profit margin between 20–25%. Margins below 15% can indicate cash flow problems, making scaling a risky move [19]. Interestingly, only 27% of Amazon sellers manage to achieve margins above 20%, though 52% maintain at least a 10% margin [2].
Strong profit margins also provide a cushion against "fee creep" - the annual rise in Amazon’s fees, which can eat into profits by 2–5% [2][20]. Without this buffer, seasonal fee hikes can disrupt your ability to reinvest during critical periods.
Another sign you're ready to scale is when healthy margins align with a Total Advertising Cost of Sales (TACoS) below 15%. TACoS measures your ad spend relative to total revenue, offering a clearer picture of whether your advertising efforts are driving overall growth. As Dan Ashburn, Co-Founder of Titan Network, explains:
"TACoS reveals what ACoS masks: the real relationship between your advertising investment and total business profitability" [22].
Established brands often aim for a TACoS between 8–12%, while anything above 15% may indicate over-reliance on paid traffic.
Return on Ad Spend (RoAS) is another critical metric. While a RoAS above 3× is a general benchmark, calculating your break-even RoAS is crucial. Use this formula: (1 ÷ Contribution Margin) × 1.4 [21]. For example, if a $30 product generates $6 in pre-ad profit, you’ll need a RoAS of 4:1 to avoid losses - a 3:1 RoAS would mean you're losing money.
Balancing Ad Spend with Profitability
Focusing solely on ACoS can be misleading. A low ACoS (e.g., 15%) paired with a high TACoS (e.g., 35%) may signal overspending relative to total sales [4]. This combination often points to declining organic rankings and a weakening Amazon flywheel effect.
To calculate your break-even ACoS, use the formula: (Pre-Ad Profit Per Unit ÷ Sale Price) × 100 [23]. For instance, if your product sells for $30 and nets $6 in pre-ad profit, your break-even ACoS is 20%. Campaigns exceeding this threshold risk eroding profitability. As Robyn Johnson, CEO of Marketplace Blueprint, puts it:
"Success in advertising isn't just about driving immediate sales; it's about building long-term growth and sustainability" [24].
Regularly auditing your search terms can also improve ad efficiency. Conduct weekly reviews to identify irrelevant queries, and use negative keywords to cut wasted spend by 15–20% within a month [23]. Additionally, shift proven search terms from Broad Match to Exact Match to further refine your targeting [23][25].
Before scaling any campaign, ensure your product listing is fully optimized. This includes high-quality images and complete A+ content. Aim for a conversion rate between 8–12% before increasing ad spend - rates above 13% are excellent and signal readiness for aggressive scaling [4].
Finally, monitor how different ad types complement each other. Use Sponsored Product ads to boost immediate sales and Sponsored Brand ads to build long-term organic authority. This combination can reduce future ad dependency and create a self-sustaining flywheel. The goal is to leverage paid ads to drive sales and reviews, which in turn improve organic rankings, increase high-margin sales, and gradually lower your TACoS [23][24].
How to Use Onramp Funds for Reinvestment
Once you've analyzed your performance metrics, tying your funding strategy to these insights becomes the next key step. When your data shows you're ready to scale, accessing quick capital is crucial. Onramp Funds offers a solution through revenue-based financing, providing funding in under 24 hours. Unlike traditional lenders that focus on credit scores and collateral, Onramp assesses your real-time sales velocity, account health indicators (like Order Defect Rate), and SKU performance to determine eligibility. By integrating directly with your Amazon account, Onramp tracks sales in real time and automates repayments, ensuring your payment schedule adjusts to your actual cash flow. This approach allows you to scale while retaining full ownership. To qualify, sellers typically need at least $10,000 in monthly sales and 6–12 months of selling history. Those with a diverse, consistent product lineup often secure better terms [3].
The next step is to calculate how much funding you need based on your sales and inventory data.
Calculating Funding Needs from Your Metrics
Start by forecasting your inventory requirements using your Sales Estimate (pcs/month). For example, if you sell 300 units per month and have a lead time of 60 days, you'll need at least 600 units in stock. Then, calculate your Landed Cost of Goods (COG), which includes supplier costs, sales tax, 3PL fees, and shipping. If each unit costs $8 to source and ship, a 600-unit order would require about $4,800 in funding.
Next, use your Inventory Turnover Ratio (Cost of Goods Sold ÷ Average Inventory) to determine how quickly you're cycling through inventory. A high turnover ratio indicates the need for frequent reinvestment to avoid stockouts. Additionally, track your Days of Supply (Current Inventory ÷ Daily Sales Velocity) to time your funding application. For instance, if you have 45 days of stock but a 30-day lead time, you'll need funds to cover the 15-day gap. Before applying, ensure your ROI meets your target by calculating it as:
(Profit ÷ [COG + Sales Tax + 3PL Costs]) × 100%. Top-performing sellers often aim for an ROI of 150%–200% to account for fluctuations in fees [26][2].
Once you've nailed down your funding needs, consider how a flexible repayment model can support your scaling efforts.
Why Revenue-Based Financing Works for Growth
One of the biggest challenges with traditional loans is their fixed monthly payments, which can be tough to manage during slower sales periods. Onramp Funds offers a more flexible alternative: repayments are tied to a percentage of your actual sales. This means your payment schedule adjusts based on your cash flow, reducing financial strain. With fees ranging from 2% to 8% and a clear cost structure, you can accurately evaluate the expense of growth capital before committing.
Revenue-based financing is especially useful for high-velocity SKUs or time-sensitive opportunities, such as stocking up on inventory before peak seasons or launching marketing campaigns during high-demand periods. It also helps bridge cash flow gaps caused by Amazon's biweekly payout delays, ensuring you can act quickly when reinvestment opportunities arise [3].
Conclusion: Using Data to Make Better Reinvestment Decisions
Metrics like sales growth, inventory turnover, customer feedback scores, and profit margins act as signals for when you're ready to scale. For instance, sales velocity highlights which products deserve more investment. Inventory turnover shows how efficiently you're moving stock and identifies areas where cash might be unnecessarily tied up. Strong customer feedback scores indicate your account health can handle increased volume. And profit margins - especially when hitting that 150%–200% ROI mark - demonstrate you have the financial stability to reinvest with confidence [2].
These aren’t just numbers to track - they’re tools to guide your strategy. As Colin Bryar, former Vice President at Amazon, explains:
"To be a good operator, you can't just focus on those output metrics - you need to identify the controllable input metrics" [27].
This means focusing on actionable areas like maintaining in-stock rates, fine-tuning ad spend, and curating your product selection based on data insights.
When your metrics show it’s time to grow, acting quickly is crucial. Delays can lead to lost rankings and revenue. That’s where Onramp Funds can step in, offering funding in less than 24 hours, based on your actual sales performance. With their revenue-based repayment model, payments adjust to your cash flow, giving you flexibility during slower periods. This funding approach works hand-in-hand with your data, enabling you to seize market opportunities without hesitation.
FAQs
Which metric matters most for reinvesting?
When deciding whether to reinvest in your Amazon business, the most telling metric often ties back to your goals. That said, sales growth is usually a top contender. Why? Because increasing sales point to strong product demand and solid performance - clear signs that reinvestment could pay off.
But sales aren't the only thing to watch. Metrics like profit margins, inventory turnover, and customer feedback scores also play a big role. Looking at these together gives you a clearer picture, helping you make smarter choices that drive growth while keeping operations running smoothly.
How do I know growth isn’t seasonal?
To figure out if your growth is steady rather than tied to specific seasons, take a close look at long-term sales trends and patterns outside of peak times. Pay attention to metrics like sales growth, inventory turnover, and customer feedback scores over a span of several months. If these numbers consistently improve beyond obvious seasonal surges - like the holidays or back-to-school rush - it’s a clear indication that your growth is driven by lasting demand, not just short-term spikes.
How much funding should I request?
The amount of funding you need will hinge on factors like your inventory requirements, growth objectives, and cash flow situation. Generally, the funding aligns with your sales volume and how quickly your inventory moves. This ensures you can keep your shelves stocked, pursue growth opportunities, and maintain steady cash flow. Take a close look at these metrics to figure out the right funding level for your business.
