
-
Click-Through Rate (CTR): Measures how often people click your ad after seeing it. A good CTR is 1% or higher, with top campaigns reaching 2-5%.
Example: A brand improved CTR by 10% just by adding a compelling video. - Cost Per Click (CPC): Shows how much you're paying for each click. Lower CPC means better budget efficiency. Average CPC is $1.72, but it varies by industry (e.g., $0.45 for apparel, $3.77 for finance).
- Conversion Rate: Tracks the percentage of clicks that turn into actions like purchases. The average is 8.95%, with top industries like fitness hitting 14.29%.
- Return on Ad Spend (ROAS): Tells you how much revenue you earn for every dollar spent. Aim for at least 3:1, with high-performing campaigns reaching 4:1 or more.
- Cost Per Acquisition (CPA): Measures the cost of gaining a new customer. Average CPA is $18.68, but it differs by sector (e.g., $10.98 for apparel, $55.21 for tech).
Key Takeaway:
To maximize ROI, track these metrics together. For example, high CTR but low conversion rate? Your landing page might need work. High conversions but low ROAS? Your costs may be too high. Use these insights to refine your targeting, ad creative, and budget allocation.
| Metric | What It Measures | Good Benchmark |
|---|---|---|
| Click-Through Rate | Engagement with your ad | 1-5% |
| Cost Per Click | Efficiency of ad spend | $0.45-$3.77 (varies) |
| Conversion Rate | Actions taken after clicking | 8.95% (average) |
| Return on Ad Spend | Revenue earned per dollar spent | 3:1 or higher |
| Cost Per Acquisition | Cost to gain a new customer | Below your profit margin |
Keep these metrics in check to make smarter ad decisions and boost your profitability.
How to Analyze Your Facebook Ad Results: 7 Metrics to Track
1. Click-Through Rate (CTR)
Click-through rate (CTR) measures the percentage of people who clicked on your ad after seeing it. To calculate it, divide the number of clicks by the number of impressions and then multiply by 100 to get a percentage [3]. CTR is a key indicator of how well your ad captures attention - if no one clicks, it’s a clear sign your ad isn’t resonating.
Why does CTR matter so much? A high CTR shows that your ad is connecting with your audience. It means your ad copy, visuals, and targeting are effectively working together [3]. On the flip side, a low CTR often points to problems like targeting the wrong audience, weak messaging, or lackluster creative elements [1].
What's Considered a Good CTR?
The average CTR for Facebook ads across all industries is about 0.90% [1]. However, this number varies depending on the industry:
- Retail: 1.59%
- Apparel: 1.24%
- Beauty: 1.16%
- Technology: 1.04%
- Fitness: 1.01% [1]
For eCommerce sellers, a CTR of at least 1% is a reasonable goal. Expert campaigns often hit 2-5%, and anything above 5% is considered exceptional [1] [2] [5].
Real-World CTR Success Stories
Here are some examples of brands improving their CTR through strategic changes:
- Sleepy's Express boosted their CTR from 0.84% to 1.01% in just 80 days by fine-tuning their targeting and excluding users who had already converted [3].
- Jumpstart Go increased their CTR by 10% simply by adding a compelling video to their ad [3]. This highlights how engaging visuals can make a big difference.
- The Penny Hoarder achieved a staggering 13.7% CTR with a location-specific campaign using the headline "If you live in Pennsylvania" [3]. This shows the power of targeting combined with personalized messaging.
Tips to Improve Your CTR
If you’re looking to boost your CTR, start by refining your ad titles and incorporating engaging visuals like videos or GIFs. Short, direct, and urgency-driven copy can also make a big impact. Angelo Frisina from Sunlight Media notes, "Having a correctly optimized ad title can increase your CTR by over 50%" [3].
"When your paid media strategist narrows your targeting, you're speaking to a smaller customer base, and you now have specificity and empathy on your side." – Ian Revling, Evolve Digital Labs [3]
Avoid generic stock photos - use authentic visuals that show real people interacting with your product. Address your audience’s specific needs and pain points. Try asking thought-provoking questions in your headlines and use emojis sparingly to grab attention [1].
Next, we’ll dive into how cost per click (CPC) helps refine your ROI analysis.
2. Cost Per Click (CPC)
Once you've evaluated ad engagement using CTR, the next step is to look at Cost Per Click (CPC). This metric reveals how much you're spending for each user click, ensuring you're only paying for actual engagement. It's a key indicator of how efficiently your ads are performing [6].
Why CPC is crucial for your ROI:
CPC plays a direct role in shaping your advertising budget. It shows how effectively you're reaching the right audience. A lower CPC means you're spending your budget wisely by attracting users who are genuinely interested in your product or service [6].
Facebook CPC Benchmarks
In the United States, the average CPC for Facebook ads is $1.72 across all industries [4]. However, costs vary significantly depending on the sector. Here's a quick breakdown:
| Industry | Average CPC |
|---|---|
| Apparel | $0.45 |
| Travel & Hospitality | $0.63 |
| Retail | $0.70 |
| Technology | $1.27 |
| Beauty | $1.81 |
| Auto | $2.24 |
| Finance & Insurance | $3.77 |
For eCommerce sellers, this data highlights how industries like retail and apparel benefit from lower CPCs, while highly competitive fields such as finance face much higher costs [4].
How to Calculate CPC
The formula for CPC is simple: divide your total ad spend by the number of clicks. For instance, if you spend $100 and receive 50 clicks, your CPC would be $2.00 [8] [9] [10].
Factors That Impact CPC
Several elements can influence your CPC, including:
- The quality and relevance of your ad
- Competition within your industry
- Your chosen bidding strategy
- Ad placement options [6] [7]
Tips for Lowering Your CPC
To reduce your CPC, focus on creating ads that resonate with your audience. Use attention-grabbing visuals and clear calls-to-action. Experiment with A/B testing for headlines, imagery, and copy, while fine-tuning your audience targeting and ad placements to ensure you're getting the most value for your budget [6] [11].
Next, we'll explore how analyzing your conversion rate can deepen your ROI insights.
3. Conversion Rate
After examining CTR and CPC, the next metric to consider is conversion rate. This figure reveals the percentage of people who click on your ad and then complete a desired action, such as making a purchase, signing up, or downloading an app. Essentially, it measures how effectively your ad clicks translate into revenue-generating actions [12].
Why Conversion Rate Matters for ROI: Conversion rate plays a critical role in determining your campaign’s profitability. Even with a high CTR and a reasonable CPC, your efforts won’t pay off if visitors fail to convert on your landing page. This metric provides insight into how well your entire sales funnel functions - from the ad itself to the checkout process. To see how your campaign stacks up, compare your results against current Facebook conversion benchmarks.
Facebook Conversion Rate Benchmarks
In 2025, the average Facebook ad conversion rate across industries is 8.95%, a slight dip from 9.21% in 2024 [12]. However, what qualifies as a "good" conversion rate can vary significantly depending on your industry and the type of campaign you're running.
A conversion rate above 10% is generally considered strong, while anything below 3% may indicate issues within your sales funnel [12]. Here’s a breakdown of average conversion rates by industry:
| Industry | Average Conversion Rate |
|---|---|
| Fitness | 14.29% |
| Education | 13.58% |
| Employment & Job Training | 11.73% |
| Healthcare | 11.00% |
| Real Estate | 10.68% |
| B2B | 10.63% |
| Consumer Services | 9.96% |
| Finance & Insurance | 9.09% |
| Beauty | 7.10% |
| Home Improvement | 6.56% |
| Legal | 5.60% |
| Auto | 5.11% |
| Apparel | 4.11% |
| Retail | 3.26% |
| Travel & Hospitality | 2.82% |
| Technology | 2.31% |
| Industrial Services | 0.71% |
These numbers reflect the varying behaviors of online consumers. For example, industries like fitness and education see higher conversion rates, while sectors such as travel and technology face lower averages due to longer decision-making processes [12].
Tracking Your Conversion Rate
To track conversions effectively, tools like Meta Pixel and the Conversions API are essential, especially as data privacy regulations evolve. Facebook Ads Manager also offers detailed reporting options, allowing you to analyze performance across campaigns and audience segments.
Improving Your Conversion Rate
If your conversion rate dips below 5%, it’s a sign to take a closer look at your sales funnel [12]. Often, the issue lies not with the ad itself but with the landing page experience.
Here are some steps to improve conversions:
- Optimize your landing page: A one-second faster load time can increase mobile conversions by 27% and reduce bounce rates [14].
- Align your message: Ensure your landing page headline and offer match the ad, keeping visitors focused on the intended action [13].
- Eliminate distractions: Remove unnecessary elements that could divert attention from your primary goal [13].
- A/B test key elements: Experiment with different headlines, images, and even the checkout process to see what resonates most with your audience [13].
- Streamline the checkout process: For eCommerce, offering guest checkout, multiple payment options, and clear pricing can significantly improve conversion rates [14].
4. Return on Ad Spend (ROAS)
ROAS, alongside metrics like CTR, CPC, Conversion Rate, and CPA, offers a well-rounded picture of your ad performance. It specifically measures how much revenue you make for every dollar spent on Facebook ads[15].
Why ROAS Matters for eCommerce:
ROAS connects your advertising spend directly to revenue, making it an essential metric for planning budgets and refining campaigns. Instead of just looking at clicks or engagement, it focuses on profitability by highlighting the actual sales generated through your ad investment.
How to Calculate ROAS
The formula for ROAS is straightforward: divide the revenue generated from your Facebook ads by the total ad spend. For instance, if you spend $1,000 on ads and generate $4,000 in sales, your ROAS is 4:1 - meaning you earn $4 for every $1 spent. To track this accurately, ensure Facebook Pixel and conversion tracking are properly set up in your Ads Manager account[15].
Once you’ve calculated your ROAS, compare it to industry benchmarks to assess how well your campaigns are performing.
What’s a Good ROAS?
A baseline ROAS of 3:1 is generally recommended, though this can vary by industry. High-margin businesses may operate with a lower ratio, like 2:1, while low-margin retailers often require higher ratios above 3:1[16].
Here’s a quick look at some benchmarks:
| Business Type | Minimum ROAS | Strong Performance |
|---|---|---|
| eCommerce (General) | 3:1 | 4:1+ |
| Retargeting Campaigns | 5:1 | 6:1+ |
| Prospecting Campaigns | 2:1 | 3:1+ |
| Dynamic Product Ads | 3.5:1 | 4.5:1+ |
The average eCommerce ROAS is around 2.87:1, but optimized campaigns often hit 4:1 or higher.
ROAS Across Different Platforms
When comparing platforms, Facebook Ads stand out as a strong performer. While Google Ads average a ROAS of 13.76 and Instagram delivers around 8.83, Facebook Ads typically achieve an average ROAS of 10.68. In contrast, Amazon averages about 7.95, and TikTok trails with approximately 2.5[18].
If your Facebook ROAS isn’t meeting these benchmarks, it’s time to tweak your strategy.
Tips to Boost Your ROAS
- Refine Your Audience: Leverage Facebook’s targeting tools to focus on high-conversion users. Use data from your campaigns to identify top-performing customer segments.
- Optimize Your Ad Creative: Regularly test different visuals, headlines, and calls-to-action to see what resonates most with your audience.
- Improve Landing Pages: Ensure your landing page delivers on the promise of your ad and provides a smooth path to purchase.
- Reallocate Your Budget: Analyze your ROAS regularly and shift funds toward campaigns delivering the best results. Retargeting campaigns often outperform prospecting ones.
For businesses looking to scale their Facebook ad efforts, maintaining cash flow is key. Strong ROAS allows you to reinvest in successful campaigns, driving further growth. If you need additional working capital to scale, revenue-based financing options - like those offered by Onramp Funds - can help you increase ad spend and invest in inventory, keeping your momentum going.
sbb-itb-d7b5115
5. Cost Per Acquisition (CPA)
Cost Per Acquisition (CPA) measures how much it costs to gain a paying customer through your Facebook ad campaigns [19]. It’s a key metric for understanding how efficiently your ad spend translates into new customers and, ultimately, profitability [19][20].
How to Calculate CPA
To find your CPA, divide your total ad spend by the number of new paying customers [19]. For example, if a subscription box service spends $6,000 on Meta Ads and gains 400 new subscribers, the CPA would be $15 ($6,000 ÷ 400) [21].
"CPA is a metric that measures the cost of acquiring a new paying customer through your Facebook Ads." - Mike Signorella, ThoughtMetric [22]
While CPA focuses on paying customers, it's worth noting that Cost Per Conversion tracks other desired actions, like form submissions or downloads, which don’t always lead to sales [19].
What's a Good CPA?
The average CPA for Facebook Ads can vary widely depending on the industry. Reports suggest an overall average of $18.68 [4], though some sources indicate $8.26 [21]. Here’s a breakdown by industry:
| Industry | Average CPA |
|---|---|
| Education | $7.85 |
| Apparel | $10.98 |
| Healthcare | $12.31 |
| Fitness | $13.29 |
| Real Estate | $16.92 |
| Retail | $21.47 |
| Travel & Hospitality | $22.50 |
| B2B | $23.77 |
| Beauty | $25.49 |
| Auto | $43.84 |
| Home Improvement | $44.66 |
| Technology | $55.21 |
A good CPA should be comfortably below your Average Order Value (AOV) or Customer Lifetime Value (LTV). If your CPA is too close to your AOV, you might struggle to maintain healthy profit margins after covering other expenses [19].
Strategies to Lower Your CPA
-
Refine Your Targeting:
Use Facebook's audience insights to zero in on users most likely to convert. Custom audiences built from existing customer data tend to yield lower CPAs, while lookalike audiences can help you find similar high-value prospects. -
Optimize Your Ad Creative:
Test different ad formats and designs to see what resonates most with your audience. Video ads often outperform single-image ads, and refreshing your creatives regularly can prevent ad fatigue. -
Improve Your Landing Pages:
Ensure your landing pages are designed to convert. Clear messaging, easy navigation, and customer testimonials can make a big difference. A smooth user journey from ad click to purchase can significantly reduce your CPA. -
Smart Budget Management:
Use lifetime budgets to let Facebook distribute your spending effectively. Set cost caps and monitor ad frequency to avoid overspending.
"Consider all the costs that are involved in acquiring a new customer. This includes advertising costs, sales team costs, proposal development costs, marketing automation software costs, content creation costs, events and trade show costs, and any other costs directly related to acquiring new customers. This provides a clear picture of the Cost per Acquisition and helps optimize marketing strategies and budget allocation." - Adam Binder, Creative Click Media [19]
- Leverage Retargeting:
Focus on users who’ve already interacted with your website or products. These warmer audiences generally convert at higher rates and lower costs compared to entirely new prospects.
By combining CPA insights with other key performance indicators, you can paint a more complete picture of your ROI.
When you find campaigns with low CPAs, it’s often a good idea to scale them quickly. To do this without straining your cash flow, consider revenue-based financing options like those from Onramp Funds. They can provide the capital you need to expand your best-performing Facebook ads while keeping acquisition costs under control.
Using Metrics Together for Complete ROI Analysis
Each metric provides a piece of the puzzle, but when you analyze them together, you get a clearer picture of your campaign's performance. For example, CTR (click-through rate) shows how engaging your ads are, CPC (cost-per-click) reveals how much you're spending to drive traffic, and ROAS (return on ad spend) measures how much revenue you're generating for every dollar spent [17].
Let’s break it down: if you have a high CTR but a low conversion rate, it could mean your ad messaging doesn’t align with your landing page. On the other hand, a low CTR paired with a high conversion rate might suggest your targeting is too narrow. High conversions but low ROAS? That’s often a sign your conversions are too costly [17].
"ROAS gives a direct report of the profit you gain for that specific ad campaign. A high ROAS equates to a high ROI, while a low metric would alert you that the campaign isn't successful and might be a poor use of funds to continue - at least without making any adjustments to your strategy."
– David Gaglione, Founding Partner, PS212 [24]
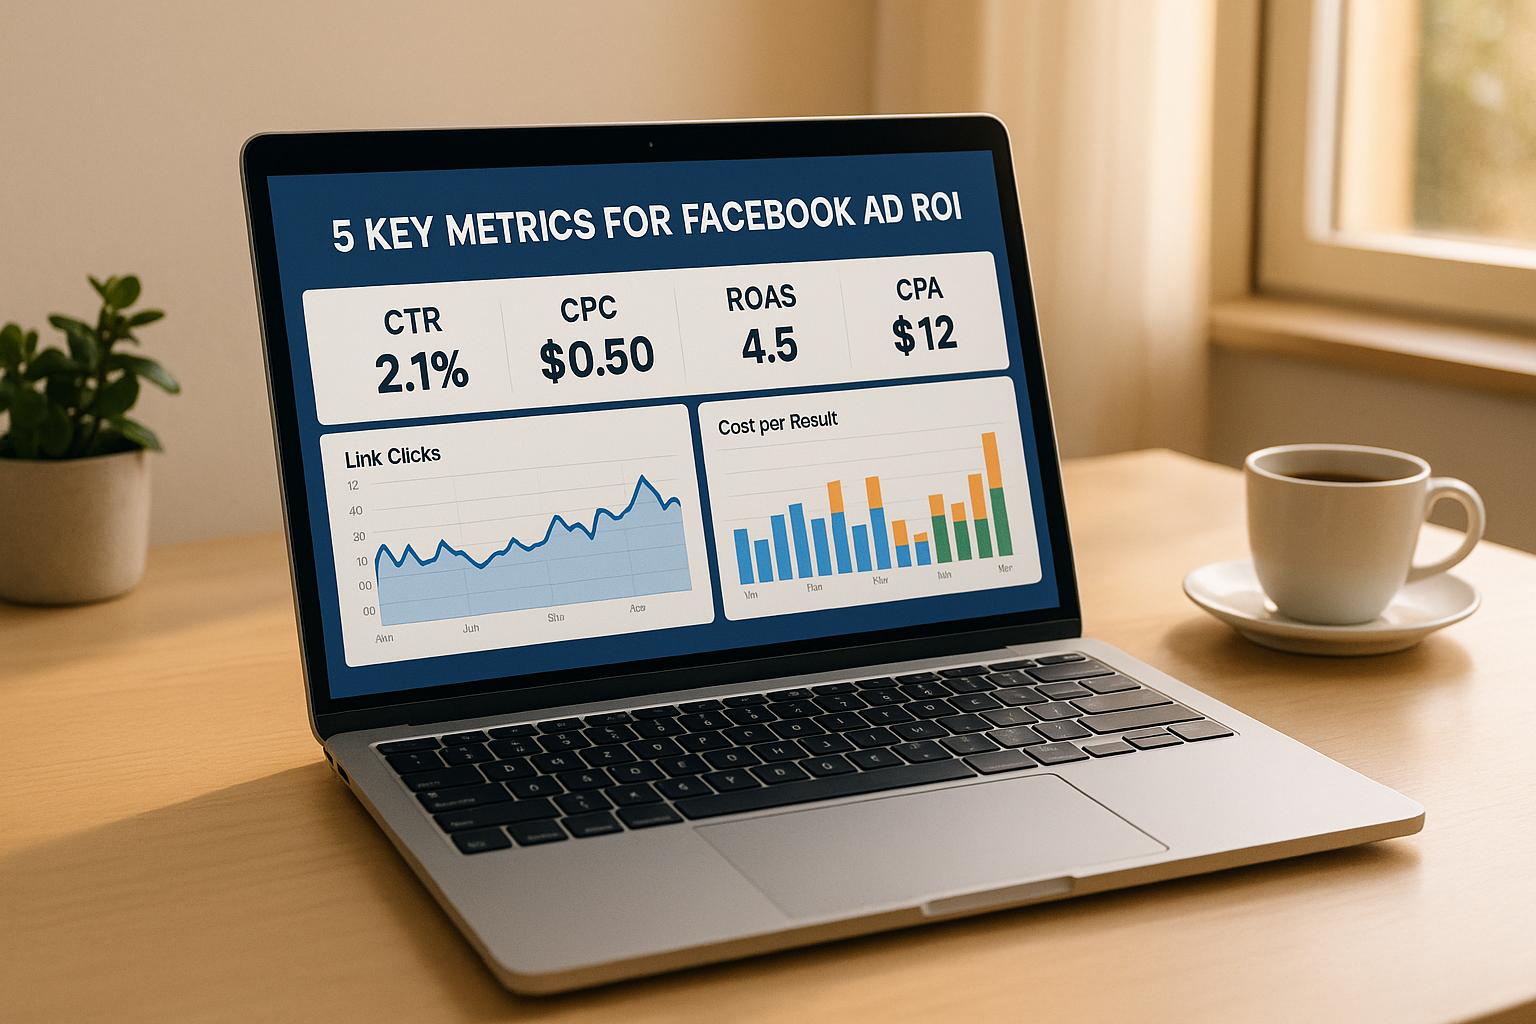
This highlights the importance of looking at these metrics as a team rather than in isolation. By monitoring them together, you can fine-tune your targeting, adjust your creative, and make sure your ad spend is working effectively [23]. To give you an idea of benchmarks: Facebook ads often see a CTR of 1–2%, e-commerce campaigns typically aim for a ROAS of 4:1 or higher, and CPC can range from $0.50 to $3.50 depending on the industry [17].
To improve performance, ensure your ad promises match the content on your landing pages. Techniques like retargeting, adding social proof, creating urgency with limited-time offers, and continuously testing ad designs and landing pages can help boost conversions [17].
For even better results, consider using tools like Facebook’s Campaign Budget Optimization (CBO), which automatically allocates your budget across ad sets for maximum efficiency. If your CPA (cost per acquisition) doesn’t improve after the first week, revisit your campaign setup, targeting, and creative strategy [17]. Keep an eye on micro-conversions, adjust bids during peak hours, and refresh your ad creative regularly to maintain engagement [17].
When you spot campaigns that perform well across these metrics, scaling them quickly is key. But scaling often requires more resources. Solutions like revenue-based financing from Onramp Funds can provide the extra capital you need to grow your campaigns without straining your cash flow.
Think of these metrics as interconnected tools that guide your strategy. Set realistic ROAS goals based on your industry and business model, and use these benchmarks to allocate budgets and refine performance across your offerings [17]. By aligning these insights with your ROI goals, you can build a strong foundation for successful and profitable Facebook ad campaigns.
Conclusion
Monitoring five essential metrics - CTR, CPC, conversion rate, ROAS, and CPA - offers a well-rounded view of your Facebook ad performance. Each metric provides meaningful insights, helping you pinpoint areas of success and identify where adjustments are needed.
With over 3 billion active users spending an average of 33 minutes daily on Facebook[25], and 74% of users falling into higher income brackets[26], the platform presents a massive opportunity for eCommerce businesses. But tapping into this potential requires focusing on what truly matters - tracking the right data and optimizing your campaigns accordingly.
Once you’ve analyzed your metrics, the next step is turning those insights into action. For instance, if a campaign achieves your target ROAS (ideally 2:1 or better), consider increasing its budget incrementally by 20–30% every few days[27]. Use lookalike audiences based on your top customers, refresh your ad creatives frequently to avoid fatigue, and implement retargeting strategies to engage high-intent shoppers[27].
Regular analysis ensures your ad spend is used wisely, helps you identify winning approaches more quickly, and supports long-term growth[28].
As your campaigns succeed and scale, don’t overlook the need for additional resources. Scaling often calls for more capital. If you have high-performing ads that could generate significant returns with additional funding, revenue-based financing from Onramp Funds can provide the cash flow you need without affecting your equity or financial stability.
Keep your focus on the metrics that matter most. Balance engagement with conversions, optimize for mobile users, and experiment with new audiences and creatives. With a clear ROAS target of 2:1 or higher[26][28], you’ll have a solid framework for growth.
FAQs
How can I boost the click-through rate (CTR) of my Facebook ads for better results?
To improve your Facebook ad's click-through rate (CTR), focus on creating visuals that immediately capture attention. Think vibrant images, engaging videos, or dynamic animations. Pair these visuals with short, relatable ad copy that speaks directly to your audience and includes a clear call-to-action (CTA) - something that motivates users to click.
Don't stop there. Test different combinations of headlines, images, and CTAs to find what clicks (pun intended) with your audience. Make sure your message aligns with their interests and needs - it’s all about relevance. And don’t forget to keep an eye on performance metrics. Regularly reviewing these and tweaking your ads based on what works will help you fine-tune them for stronger engagement.
How can I reduce my Facebook ad costs and boost profitability?
To cut down on your Facebook ad costs and boost profitability, start by sharpening your ad targeting. Use features like lookalike audiences and retargeting to zero in on users who are most likely to engage with your ads. By narrowing your audience, you can ensure your budget is spent on reaching people who are more likely to take action.
Next, work on improving your ad creative and landing pages. Eye-catching visuals, persuasive ad copy, and a smooth, user-friendly landing page experience can make a big difference in driving engagement and conversions. To fine-tune your approach, run regular A/B tests on your ad designs, formats, and placements to see what resonates most with your audience.
Lastly, set bid caps to keep your spending in check and make the most of your budget. Keep a close eye on your campaigns, making adjustments as needed to maintain a strong return on investment (ROI) while keeping costs manageable.
How can I tell if my Facebook ad ROAS is good for my industry, and what should I do if it’s not meeting expectations?
Is Your ROAS Competitive?
To determine if your return on ad spend (ROAS) is on par with your industry, it’s helpful to compare it against common benchmarks. These typically fall between 300% and 800%, depending on your niche. For instance, a ROAS of 400% means you’re generating $4 in revenue for every $1 spent on advertising.
If your ROAS isn’t where you’d like it to be, it’s time to fine-tune your campaigns. Consider narrowing down your audience targeting, enhancing your ad creatives, boosting your average order value, or reallocating your budget to better-performing areas. Consistent testing and analysis are key to improving your returns and staying competitive within your industry.
