
Want to know if your Facebook ads are making money? Start here.
Facebook Ads ROI (Return on Investment) tells you how much profit you’re making from your ad campaigns after accounting for all costs. It’s different from ROAS (Return on Ad Spend), which only looks at revenue from ad spend. ROI digs deeper by including product, shipping, and other expenses to show true profitability.
Here’s the formula:
ROI = ((Total Revenue – Total Investment) / Total Investment) × 100
Key Steps to Calculate Facebook Ads ROI:
- Track Total Revenue: Use tools like Facebook Pixel and Google Analytics to measure revenue from ad-driven sales.
- Calculate Total Investment: Include ad spend, creative development, software, and labor costs.
- Apply the Formula: Plug your numbers into the ROI formula to see if your campaigns are profitable.
Example:
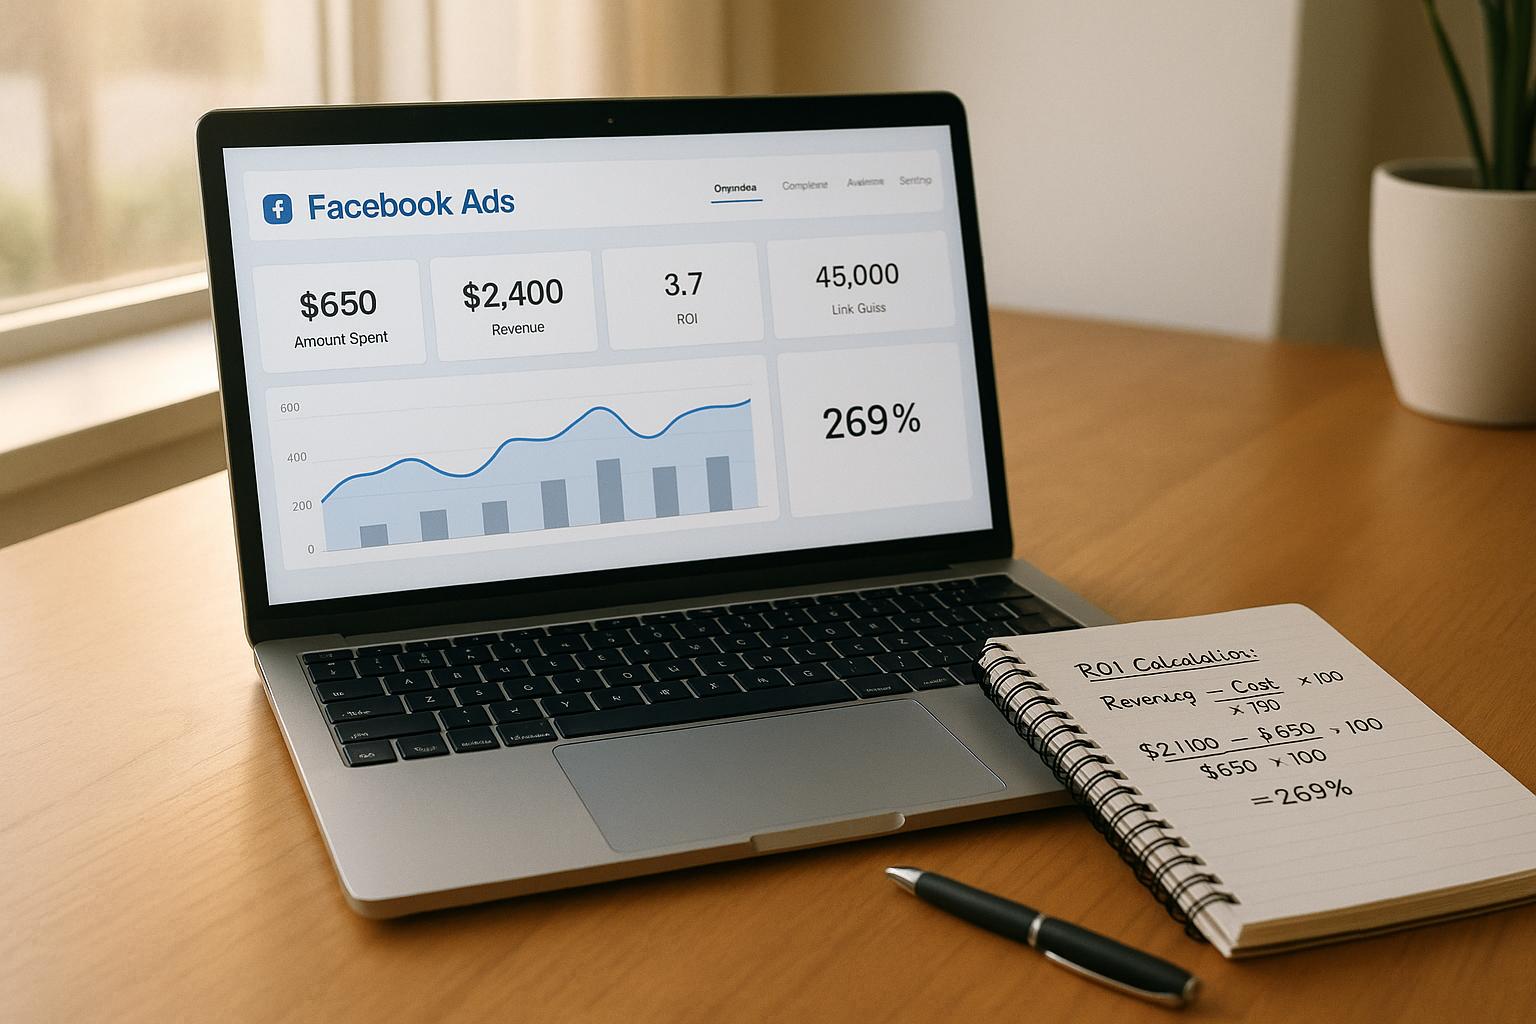
If you spend $5,000 and earn $20,000, your ROI is 300% - you make $3 for every $1 spent.
Pro Tip: A strong ROI for Facebook ads is typically 400-500%, but it varies by industry. If your ROI is negative, revisit your strategy and tracking methods.
Why It Matters: ROI helps you decide which campaigns to scale and which to cut, ensuring your ad budget drives real profits.
Let’s dive into how to track metrics, calculate ROI, and optimize your campaigns for better results.
What is ROAS? (vs ROI - ROMI) - Hacks to improve your Facebook ROAS + Calculator + FREE GDS Template
Key Metrics for Calculating Facebook Ads ROI
To calculate Facebook Ads ROI effectively, you need to track specific metrics that provide the performance insights necessary for informed decision-making. Without the right data, you risk losing opportunities to optimize your budget and improve results. Let’s break down the essential metrics you should monitor.
Key Metrics to Track
Total Revenue from Facebook Ads is the first metric to consider. This includes all sales that can be directly linked to your Facebook campaigns, from immediate purchases to follow-up transactions by customers who first discovered your business through these ads.
Total Investment covers all the costs tied to your campaigns. For example, the median monthly spend on Facebook Ads across industries was $784.33 in December 2024 [7]. Beyond ad spend, you also need to factor in expenses like creative development, software subscriptions, labor for campaign management, and any third-party service fees.
Net Profit is the ultimate measure of success, calculated by subtracting all expenses - such as product costs, shipping, fulfillment fees, payment processing, and customer service - from your total revenue. This metric helps determine whether your campaigns are genuinely profitable.
Conversion Value reflects the revenue generated from each conversion. Facebook ads typically convert at an average rate of 9.21% [11]. By understanding the value of each conversion, you can focus on attracting high-quality leads rather than just increasing volume.
Customer Lifetime Value (CLV) becomes especially important for businesses with repeat customers or subscription models. Since 74% of Facebook users are high-income earners [6], the platform often attracts customers with long-term potential. Including CLV in your analysis provides a fuller picture of your campaigns’ impact.
David Gaglione, Founding Partner at PS212, underscores the importance of these metrics:
"ROAS gives a direct report of the profit you gain for that specific ad campaign. A high ROAS equates to a high ROI, while a low metric would alert you that the campaign isn't successful and might be a poor use of funds to continue - at least without making any adjustments to your strategy." [8]
How to Collect Data for ROI Calculation
Accurate data collection is essential for calculating ROI. Here’s how to gather the information you need efficiently.
Facebook Ads Manager is a core tool for tracking ad performance. It provides detailed data on your ad spend, reach, impressions, and click-through rates. You can also see cost-per-click, which averages $1.72 across industries [11]. However, it’s important to note that Facebook Ads Manager only tracks activity within Facebook’s ecosystem, so you’ll need additional tools for a complete view.
Google Analytics complements Facebook Ads Manager by offering insights into user behavior after they click on your ads. By using UTM parameters in your campaigns, you can track website traffic, conversions, and engagement. To find this data in Google Analytics, go to Acquisition > Campaigns > All Campaigns or use the Source/Medium filter to isolate Facebook Ads traffic [9]. Google Analytics 4 also provides deeper insights into how Facebook ads influence user actions on your site [10].
Internal Sales Tracking Systems are critical for connecting Facebook traffic to actual revenue. Your CRM, eCommerce platform, or sales database can help identify which purchases originated from Facebook campaigns and track their value over time.
Additionally, tools like Ruler Analytics can monitor visitors across multiple landing pages and marketing channels while integrating directly with your CRM [1]. Implementing proper attribution tracking, such as Facebook Pixel, ensures you can link ad performance to revenue outcomes effectively [6].
Step-by-Step Guide to Calculating Facebook Ads ROI
Here's a clear process to help you calculate the ROI of your Facebook Ads. Start by determining all associated costs, track the revenue generated, and then apply the ROI formula to measure your campaign's success.
Step 1: Calculate Total Investment
Your total investment includes more than just your ad spend - it’s every dollar that goes into running your Facebook campaigns.
First, account for your direct ad spend, which is the amount you pay Facebook to run your ads. Then, add creative development costs, such as fees for graphic design, video production, copywriting, and any stock assets like photos or music.
Don't forget tool and software subscriptions. For example, if you spend $50 per month on a design tool and $100 per month on analytics software, that's $150 in monthly expenses tied to your campaigns.
Lastly, factor in labor costs. If your marketing manager spends 10 hours weekly on Facebook campaigns and earns $30 per hour, that’s $300 a week in labor.
For instance, if your monthly expenses include $2,000 on ads, $300 on creative development, $150 on tools, and $1,200 on labor, your total investment is $3,650.
Once you've tallied your costs, the next step is to track the revenue these investments generate.
Step 2: Track Revenue from Facebook Ads
Tracking revenue accurately means pulling data from several sources to understand how your ads contribute to sales.
Use tools like Facebook Pixel and the Conversions API to monitor website conversions, such as purchases or sign-ups. Set up events in Facebook’s Events Manager to track key actions - a must, especially after iOS 14 privacy updates.
Implement consistent UTM codes (e.g., utm_source=facebook&utm_medium=cpc&utm_campaign=summer_sale) to track traffic and conversions in your analytics platform.
Pay close attention to attribution windows. Facebook offers four options: 1-day click, 7-day click, 1-day click or view, and 7-day click or 1-day view. For quick, impulse buys, a 1-day window might work, but for bigger purchases requiring more consideration, a 7-day window often provides better insights.
"Attribution is tricky...All we can do is piece together a lookbook of touchpoints to get an idea of what's driving conversions" [12].
Mark Bradley, an economist, highlights:
"Attribution shows an ad influenced a conversion. It doesn't prove that the ad directly caused the sale" [12].
To get a full picture, compare Facebook’s data with your CRM or eCommerce platform. This helps identify customers who first interacted with your brand via Facebook but completed their purchase elsewhere.
Once you’ve mapped out both your costs and revenue, you’re ready to calculate ROI.
Step 3: Apply the ROI Formula
With your total investment and revenue in hand, use this formula to calculate ROI:
ROI = ((Total Revenue – Total Investment) / Total Investment) × 100
Here are two examples:
-
If you spend $5,000 on a campaign (including all costs) and generate $20,000 in revenue, the calculation is:
((20,000 – 5,000) / 5,000) × 100 = 300%
This means you earn $3 for every $1 invested. -
For a campaign costing $30,000 and generating $75,000, the formula is:
((75,000 – 30,000) / 30,000) × 100 = 150%
In this case, you earn $1.50 for every $1 spent.
A strong Facebook Ads ROI often ranges between 400% and 500%, though this depends on your industry and campaign goals [8]. David Gaglione, founding partner of PS212, explains:
"ROAS gives a direct report of the profit you gain for that specific ad campaign. A high ROAS equates to a high ROI, while a low metric would alert you that the campaign isn't successful and might be a poor use of funds to continue - at least without making any adjustments to your strategy" [8].
If your ROI is negative, it’s time to revisit your tracking and attribution methods. Sometimes campaigns that appear unprofitable in the short term can still bring in valuable long-term customers.
Advanced Techniques for Accurate ROI Analysis
Basic ROI calculations provide a starting point, but to truly understand the impact of your Facebook campaigns, you need more advanced methods. These techniques help differentiate between ads that drive actual sales and those that merely correlate with purchases.
Attribution Modeling and Its Impact
Attribution modeling is all about connecting the dots between your ads and customer actions. It helps you understand how various touchpoints influence a purchase. There are two main types: single-touch models, which credit only one interaction (like the first or last), and multi-touch models, which spread the credit across multiple interactions.
The choice of attribution model depends on your business goals. For instance:
- First-touch attribution is ideal for brand awareness campaigns, as it highlights how well you're reaching new customers.
- Position-based attribution often suits e-commerce businesses, as it emphasizes key touchpoints in the customer journey.
- Linear or data-driven attribution works well for B2B companies with longer sales cycles, where every interaction plays a role.
Another key factor is the attribution window, which should align with your sales cycle. Quick, impulse purchases might require a 1-day window, while more considered purchases could need a 7-day window to fully capture the customer journey.
Understanding these models and tailoring them to your business sets the stage for deeper analysis using incrementality testing.
Incrementality Testing and Marketing Mix Modeling
Attribution models are helpful, but incrementality testing takes your ROI analysis to the next level by answering a critical question: Did your Facebook ad directly cause the sale, or would it have happened anyway? This method measures the true impact of your campaigns by comparing results from two groups: one that sees your ads (test group) and one that doesn’t (control group). The difference in conversions reveals the incremental lift your ads provide.
Research underscores its importance. Forrester found that incrementality testing can improve marketing ROI by 30% [15]. Additionally, Facebook’s analysis of 580 conversion lift tests showed that traditional attribution and incrementality measurement disagreed 23% of the time on which tactics performed best. Advertisers relying solely on attribution missed out on a 64% improvement in cost per conversion [14].
Alok Gupta, Director of Data Science at Airbnb, highlights its value:
"Measurement is critical for two things. One is to understand the ROI we are getting and correctly account for the source of that growth. And second, to enable optimization across our different paid channels so we can decide where our next dollar of marketing budget should be spent." [14]
Start with holdout tests by pausing ads for a specific audience segment. Comparing conversions between this group and those still exposed to ads reveals whether your campaigns are driving incremental revenue or merely capturing sales that would have happened anyway.
For a broader perspective, you can use Marketing Mix Modeling (MMM). This approach evaluates the combined impact of all marketing channels over time. However, unlike incrementality testing, MMM often measures correlation rather than direct causation [16].
Incrementality testing is especially useful for e-commerce businesses analyzing retargeting campaigns. These campaigns often show high attribution numbers but may have low incremental value if customers were already planning to purchase.
Using Third-party Tools to Supplement Data
While Facebook’s native reporting offers basic insights, advanced ROI analysis often requires additional tools to fill in the gaps. With Facebook generating over $160 billion in ad revenue in 2024, its focus remains on broad functionality rather than deep analytics [17].
To begin, UTM parameters are essential. Use consistent formatting, such as utm_source=facebook&utm_medium=cpc&utm_campaign=summer_sale, to track traffic in tools like Google Analytics. This gives you a backup data source when Facebook’s attribution data feels incomplete.
Third-party platforms can take your analysis further by consolidating cross-channel data and offering AI-powered insights. Look for tools that provide:
- Seamless Facebook integration
- Customizable dashboards
- The ability to combine data from multiple sources
Popular options include advanced analytics platforms and enterprise solutions designed for comprehensive attribution modeling across all channels [17][18].
The best tools integrate data from Facebook, your CRM, and other marketing channels. This unified view helps you identify campaigns that contribute to long-term customer value, such as repeat purchases or higher lifetime value, rather than just focusing on immediate conversions.
Many businesses find that their most impactful Facebook campaigns aren’t always the ones with the highest short-term conversion rates. Instead, they are the campaigns that attract loyal customers who provide lasting value.
sbb-itb-d7b5115
Using ROI Data to Optimize Facebook Ad Campaigns
Once you've mastered the art of ROI analysis, the next step is using those insights to sharpen your Facebook ad strategies. Instead of treating ROI as just another metric, think of it as a guiding tool to make smarter decisions and boost your campaign performance.
Setting ROI Benchmarks and Goals
Start by setting clear ROI goals that align with your business objectives, whether that's generating revenue, capturing leads, or increasing engagement [13]. Generally, a 200% ROI is seen as a solid target, while many successful advertisers aim for 200-400% [5]. However, what qualifies as a good ROI can vary widely depending on your industry and business model. For instance, e-commerce businesses often achieve higher ROIs due to their direct sales model, while service-based businesses with longer sales cycles may have lower ROIs but higher customer lifetime values [5].
Make sure to account for all costs - ad spend, tools, content creation, and even team hours - when calculating your ROI [13]. Use historical data or industry benchmarks to set realistic expectations, keeping in mind that factors like seasonal trends, competition, and shifting consumer behavior can cause fluctuations [5]. According to Statista, 28% of marketers identified Facebook as the social platform delivering the highest ROI [13]. If your ROI consistently trends negative, it might be time to revisit your strategy rather than lowering your expectations [5].
Tracking ROI and Making Campaign Adjustments
To keep your campaigns on track, monitor ROI regularly and set up reliable reporting systems for real-time tweaks. Focus on metrics that tie directly to revenue instead of getting caught up in vanity metrics. Tools like consistent UTM parameters, Meta Pixel, and standardized naming conventions can help ensure accurate tracking of your Facebook ad performance [3].
"ROI is a crucial metric that helps you figure out if your advertising spend is bringing in enough revenue to justify the cost. It's the difference between throwing money into a black hole and running a profitable campaign that boosts your bottom line."
– Jack Evans, Digital Marketing Specialist, Upbeat Agency [5]
Testing plays a big role in optimization. A/B testing in Meta Ads Manager allows you to experiment with one element at a time, whether that's ad copy, visuals, or targeting [3]. Real-world examples highlight the value of this approach. For instance, HawkSEM reported that Apotheke's personalized Facebook ads boosted conversion rates by 25% and improved ROAS by 62% year-over-year by focusing on audience segmentation and tailored content [8].
"I can't stress enough how significant the impact of a singular change in the ad copy or image can have on ad performance. Continuous testing leads to a better understanding of what resonates with the audience, and importantly, optimizes ad spend."
– Joe Amaral, Founder, Anthem Software [8]
Evaluate your campaign performance daily or weekly, and adjust your budget allocation at least once a month [19]. If certain ads or targeting strategies aren't delivering, pause them and redirect your budget to better-performing ones [5]. Combining organic and paid data into a unified report can also reveal how your Facebook ads contribute to your overall marketing efforts, helping you identify campaigns that drive long-term value, not just immediate conversions [3]. By fine-tuning your ad spend, you not only improve ROI but also strengthen your case for increased budget allocation.
How Onramp Funds Can Support Smarter Ad Investments
Improving ROI opens doors for strategic reinvestment, but cash flow challenges can often hold businesses back - especially in e-commerce. That’s where financing solutions like Onramp Funds come in.
Onramp Funds offers revenue-based financing tailored for e-commerce businesses aiming to scale their marketing efforts. Unlike traditional loans with fixed payments, Onramp's repayment structure adjusts based on your sales. When your Facebook ads generate more revenue, you can comfortably manage repayments, and during slower sales periods, payments decrease accordingly.
The platform integrates with major e-commerce systems like Amazon, Shopify, BigCommerce, WooCommerce, Squarespace, Walmart Marketplace, and TikTok Shop. For Facebook advertisers, this financing model allows you to scale high-performing ads immediately without giving up equity.
Businesses with at least $3,000 in monthly sales can access funding with transparent fees ranging from 2-8%, with no hidden costs. Onramp’s Austin-based support team provides personalized guidance, helping you make informed decisions about scaling your ad investments. This approach ensures you can keep profitable campaigns running, test new opportunities, and drive sustainable growth - even when cash flow is tight. By turning ROI insights into actionable strategies, Onramp Funds helps businesses stay competitive and poised for long-term success.
Conclusion
Understanding how to calculate Facebook Ads ROI is a crucial step in making informed decisions that lead to actual business growth. By distinguishing between ROI and ROAS, keeping track of essential metrics, and using tried-and-true formulas, you can assess whether your campaigns are driving profit. These basics lay the groundwork for exploring more advanced strategies to improve your results.
Precision and consistency play a significant role here. Generally, a solid ROI for Facebook Ads hovers around a 3:1 ratio, with Facebook delivering an average ROI of 152% across social media platforms [2][4].
"Calculating ROI provides the insights you need to optimize your campaigns, scale what works, and pivot away from what doesn't."
Success with Facebook advertising isn’t just about increasing your budget - it’s about spending smarter. Advanced techniques like refined attribution models, A/B testing, and AI-driven analytics can help you allocate your ad dollars more effectively.
And if cash flow is a concern, it doesn’t have to hold you back. Onramp Funds offers revenue-based financing tailored to your sales performance, allowing you to invest in high-performing campaigns without sacrificing equity.
"Everything we do at Onramp is to help our clients grow. We offer them expertise and advice at every stage of expansion, so they never feel like they are on their own."
- Eric Youngstrom, CEO of Onramp [20]
FAQs
What can I do to turn around a negative ROI on my Facebook Ads?
If your Facebook Ads are delivering a negative ROI, there are a few steps you can take to turn things around. Start by sharpening your targeting to ensure your ads are reaching the right people. Take advantage of A/B testing to experiment with different ad creatives and see which ones get the best response. Don’t overlook retargeting - it’s a great way to re-engage users who’ve already shown interest in your products or services.
Next, make sure your landing pages are set up to drive conversions. This means they should load quickly, have clear and compelling calls-to-action, and work seamlessly on mobile devices. Tools like Meta Pixel can help you track conversions and gather insights to tweak your campaigns for better results. Even small changes - like adjusting your bidding strategy or experimenting with ad placements - can have a noticeable impact over time.
How can I ensure my Facebook Ads ROI calculations are accurate?
To get a clearer picture of your Facebook Ads ROI, try digging deeper with advanced strategies like factoring in Customer Lifetime Value (LTV). This means looking at metrics like the average revenue per customer and retention rates, which can give you a better sense of your long-term gains.
You can also use attribution modeling to figure out how each interaction contributes to a conversion. On top of that, automating your data collection and using data visualization tools can help you spot any inconsistencies and fine-tune your calculations. Make it a habit to review and update your metrics regularly to keep your ROI measurements accurate and actionable.
How does Customer Lifetime Value (CLV) impact the ROI of Facebook Ads?
How Customer Lifetime Value (CLV) Impacts Facebook Ads ROI
Customer Lifetime Value (CLV) is a game-changer when it comes to measuring the ROI of Facebook Ads. Instead of just looking at short-term gains, CLV shifts the focus to the long-term revenue a customer can bring throughout their relationship with your brand.
Why does this matter? When you factor in CLV, it becomes easier to justify spending more to acquire customers who are likely to be more profitable over time. This insight helps marketers make smarter decisions about ad budgets, target high-value customer segments, and ultimately get better results from their campaigns. It’s not just about quick wins - it’s about building a strategy for lasting success.
