
Walmart Marketplace data is transforming how eCommerce sellers secure funding. Instead of relying on personal credit scores or collateral, lenders now prioritize metrics like sales trends, inventory turnover, and fulfillment reliability. These insights help sellers demonstrate consistent revenue and operational stability, making them more attractive to lenders.
Key takeaways:
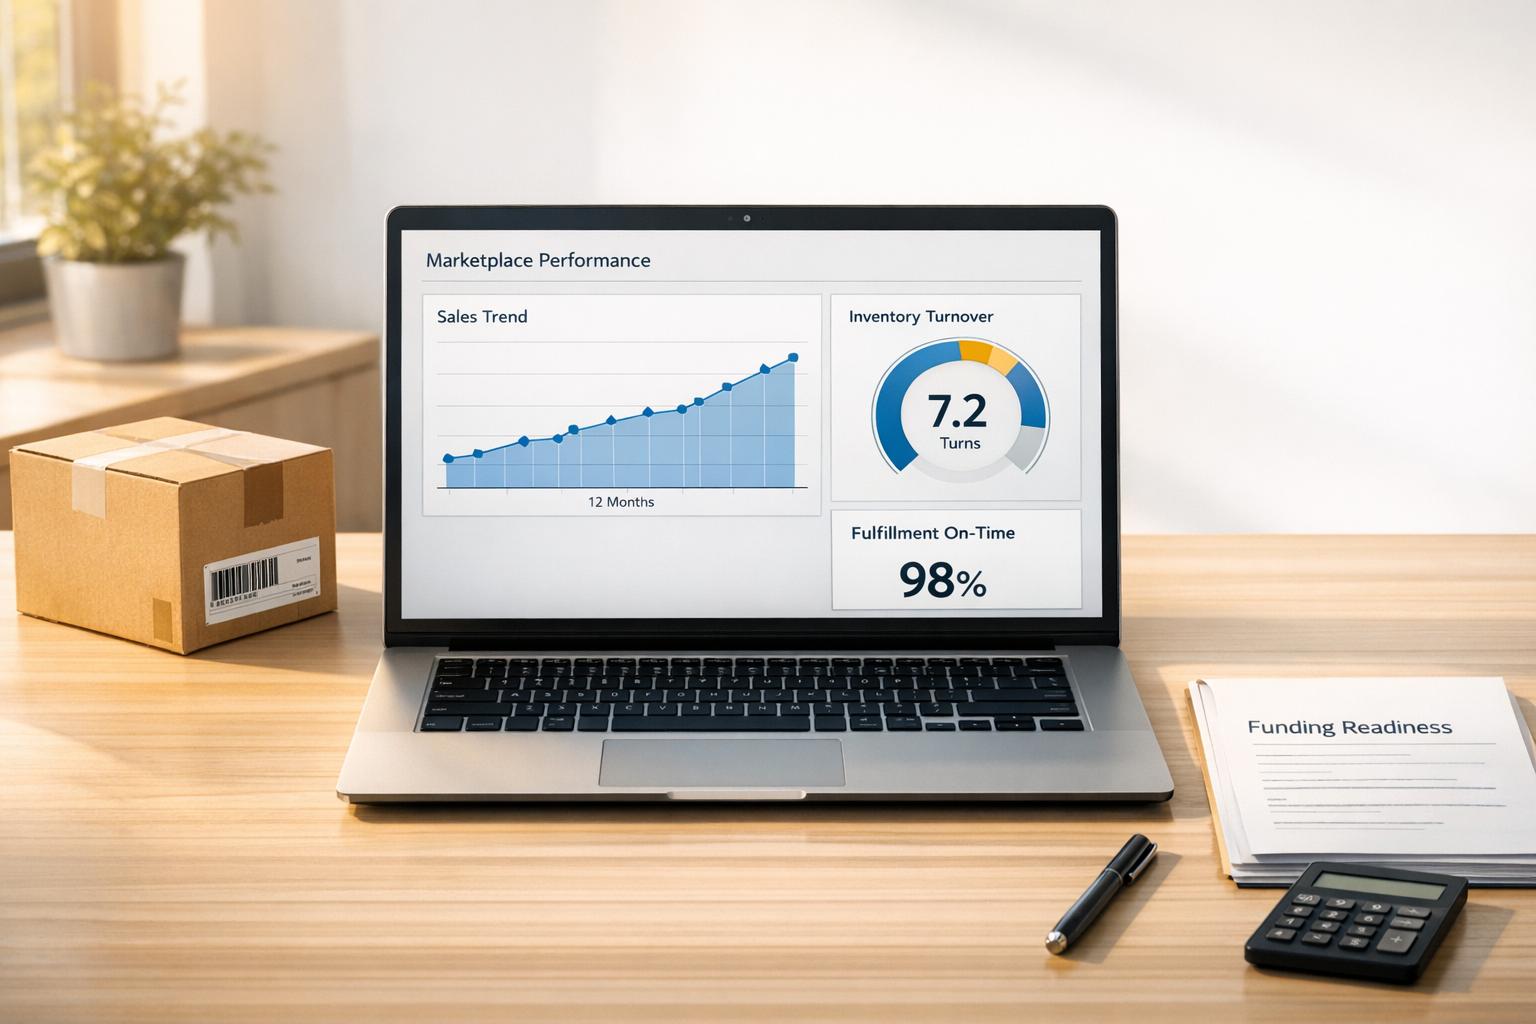
- Sales trends: Steady revenue patterns indicate demand stability.
- Inventory management: High turnover rates show efficient cash flow.
- Customer metrics: Low cancellation and refund rates highlight reliability.
- Walmart Fulfillment Services (WFS): Enhances fulfillment metrics, boosting lender confidence.
- Omnichannel data: Combining Walmart performance with Amazon or Shopify sales strengthens funding applications.
Key Walmart Marketplace Metrics for Funding Applications
Walmart Marketplace Performance Benchmarks for Funding Approval
When applying for funding, lenders don’t just look at your total sales numbers. They dig deeper, evaluating specific performance metrics that highlight how efficiently your business operates and manages cash flow. By focusing on these metrics, you can improve your day-to-day operations while strengthening your case for funding. Walmart's Seller Center provides a wealth of data, but the most critical areas include sales trends, inventory management, and customer interactions.
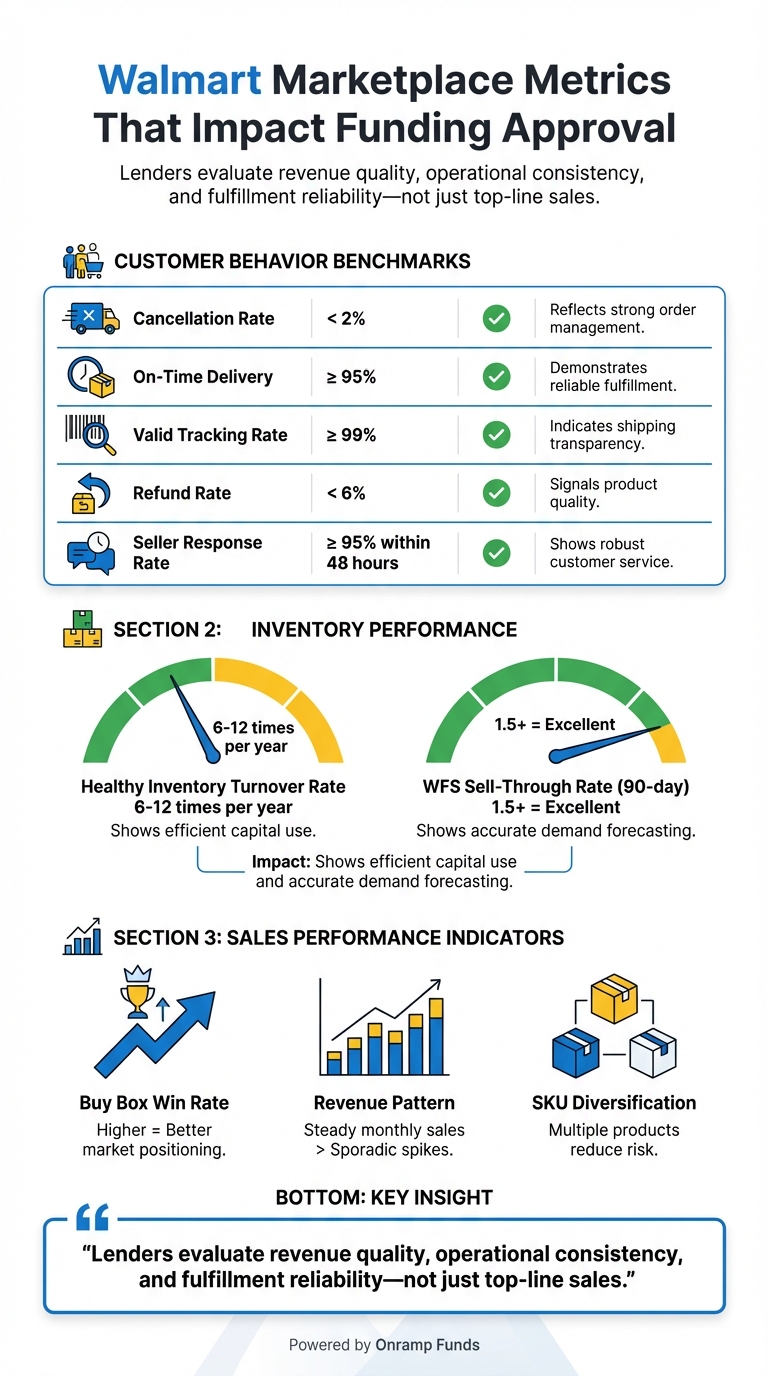
"Lenders evaluate Walmart seller performance for funding approval by analyzing revenue quality, operational consistency, and fulfillment reliability, not just top-line sales." - Onramp Funds [1]
These metrics are typically grouped into three major categories:
- Sales patterns that show stable demand
- Inventory management reflecting strong cash flow discipline
- Customer interactions that highlight product quality and service reliability
These categories collectively demonstrate your ability to maintain consistent revenue, which is essential for securing funding. Let’s break down each metric in detail.
Sales Trends Analysis
Lenders favor businesses with steady, predictable revenue over those with sporadic sales spikes. Consistent weekly or monthly sales patterns signal stable demand and reduce perceived repayment risks [1]. For example, even revenue distribution throughout the month is far more reassuring than irregular peaks. If your products are seasonal - like winter clothing - lenders expect to see strong Q4 sales complemented by reliable, baseline revenue during slower months. This balance shows that your business can thrive year-round.
Your Buy Box win rate is another important factor. This metric shows how frequently your offer appears on product pages, which depends on competitive pricing, fast shipping, and solid inventory levels [6]. A high win rate indicates strong market positioning, further boosting your appeal to lenders.
Inventory Turnover Calculation
Inventory turnover measures how quickly you sell and replace your stock. To calculate it, divide your cost of goods sold by your average inventory value. For most product categories, a turnover rate of 6 to 12 times per year is considered a healthy range [1].
"Strong inventory turnover indicates accurate demand forecasting and disciplined cash-flow management, both critical for funding approval." - Onramp Funds [1]
A high turnover rate reflects efficient use of capital, avoiding the risks of stagnant inventory. For instance, if you maintain $20,000 in inventory and turn it over six times annually, you’re generating $120,000 in sales from the same investment. Additionally, diversifying your product range can reduce risk. Relying too heavily on a single product may be seen as a vulnerability, while spreading revenue across multiple items shows resilience against market changes [1].
While sales and inventory metrics are crucial, customer behavior metrics also play a significant role in funding evaluations.
Customer Behavior Insights
Lenders closely examine how well you meet Walmart’s performance benchmarks, as these provide a clear picture of your operational stability. Key metrics include:
- Cancellation Rate: Should stay below 2% to demonstrate strong order management [7].
- On-Time Delivery: Needs to meet or exceed 95%, showing reliable fulfillment [7].
- Valid Tracking Rate: At least 99%, ensuring shipping transparency [7].
- Refund Rate: Should remain under 6%, signaling good product quality and customer satisfaction [7].
- Seller Response Rate (SRR): You’re expected to respond to 95% of customer inquiries within 48 hours [7].
High refund or defect rates can raise concerns about product quality or listing accuracy, which might indicate potential disruptions to cash flow [1]. On the other hand, meeting or exceeding these benchmarks reassures lenders of your ability to operate smoothly.
| Metric | Walmart Benchmark | Why Lenders Care |
|---|---|---|
| Cancellation Rate | < 2% | Reflects strong order management [7] |
| On-Time Delivery | ≥ 95% | Demonstrates reliable fulfillment [7] |
| Valid Tracking Rate | ≥ 99% | Indicates shipping transparency [7] |
| Refund Rate | < 6% | Signals product quality [7] |
| Seller Response Rate | ≥ 95% within 48 hours | Shows robust customer service [7] |
Participation in Walmart Fulfillment Services (WFS) can help improve many of these metrics by streamlining shipping and delivery processes.
How to Access and Analyze Walmart Marketplace Data in Seller Center
If you're selling on Walmart Marketplace, tapping into your performance data is a must, especially when preparing for funding opportunities. Walmart's Seller Center organizes this data into categories that make it easier to track and analyze. The Analytics dashboard is your go-to spot for sales performance. Head to Analytics > Overview, where you'll find three key reports:
- Account Sales: Offers a snapshot of your overall metrics, including GMV (Gross Merchandise Value), Units Sold, Orders, and Average Unit Retail.
- Item Sales: Breaks down performance by individual SKU, giving you a detailed look at which products are driving sales.
- Sales By Department: Ranks GMV by Walmart's product categories, helping you see which departments are performing best [9].
You can export these reports as CSV files by clicking Download [9].
For deeper insights into customer behavior, check out Analytics > Consumer Insights. This section provides data like repeat purchase rates, market basket analysis (showing which items are commonly bought together), and demographic details. Keep in mind, though, that access to these reports requires you to be a registered brand owner with at least 100 customers [11].
If you're using Walmart Fulfillment Services (WFS), the WFS > Inventory page is where you'll find supply chain metrics. It tracks sell-through rates, aged inventory, and days of supply. Walmart considers a 90-day sell-through rate of 1.5 or higher as "Excellent" [13].
Operational metrics are just as critical. The Performance tab monitors key aspects like order response times, cancellation rates, and refund percentages - factors that lenders often review closely [12]. Meanwhile, the Catalog > Download View > Reports section provides detailed Item Reports, covering pricing, Buy Box eligibility, and publication status for each SKU. These reports are available shortly after you generate them [10][14].
To spot growth trends and compare performance over time, use the Analytics dashboard's date range selector and toggle the Compare button. This feature lets you stack current sales against previous months or the same period from last year. You can also apply filters to focus on specific Programs, Super departments, or Brands, helping you identify which areas are driving the most revenue [9].
For high-volume sellers, the Payment Reports API is a game-changer. It lets you retrieve reconciliation reports and transaction data programmatically, ensuring you always have accurate financial data on hand [8].
Having these insights at your fingertips not only helps you manage your business better but also strengthens your case when applying for funding. Next, we’ll dive into how to use these insights to craft compelling funding applications.
Using Walmart Data to Build Funding Applications with Onramp Funds

Once you've collected your Walmart Marketplace data, the next step is putting it to work in your funding application. Onramp Funds takes a different approach from traditional lenders - there’s no emphasis on personal credit scores or lengthy bank statements. Instead, they focus on how capital flows through your business.
To start, connect your store to automatically share sales, fulfillment, and payout data with Onramp Funds. This automation speeds up the approval process and can lead to better financing terms compared to submitting static reports. Eligibility requires at least $3,000 in sales over the past 30 days, and once approved, funds are typically available within 24 hours. By aligning your Walmart data with Onramp Funds' criteria, you can strengthen your application and improve your chances of approval.
Matching Metrics to Onramp Funds Revenue-Based Financing Criteria
Onramp Funds values consistent revenue over sheer volume - steady weekly or monthly sales are more appealing than unpredictable spikes. As you review your Walmart data, focus on demonstrating stable revenue patterns. This signals demand reliability and lowers the perceived risk for lenders.
Operational metrics also play a key role. Aim for:
- Cancellation rates ≤ 2% to show operational dependability.
- Refund rates ≤ 6%, reflecting good product quality and customer satisfaction.
- On-time delivery rates ≥ 90%, which highlight reliable fulfillment processes.
If you’re using Walmart Fulfillment Services (WFS), you’re already at an advantage. WFS helps improve fulfillment metrics, making your funding profile more attractive. It also simplifies meeting Walmart’s performance standards, with the exception of the Negative Feedback Rate.
Balanced inventory levels are another important factor. They showcase careful cash-flow management and accurate demand forecasting. Additionally, diversifying your SKUs helps spread revenue sources, reducing the risk of over-reliance on a single product. Use your Item Sales report to pinpoint top performers and identify areas for improvement.
Onramp Funds doesn’t just look at your Walmart performance in isolation. They evaluate how Walmart fits into your overall omnichannel revenue. If you sell on platforms like Amazon or Shopify, connecting those accounts can provide a more complete picture of your business, potentially leading to better funding terms.
| Metric | Target Standard | Why It Matters |
|---|---|---|
| Cancellation Rate | ≤ 2% | High rates suggest operational instability. |
| Refund Rate | ≤ 6% | Reflects product quality and customer trust. |
| On-Time Delivery | ≥ 90% | Boosts lender confidence in fulfillment. |
| Inventory Turnover | Balanced (no stockouts/overstock) | Indicates accurate forecasting. |
| SKU Performance | Diversified across items | Reduces risk from relying on one product. |
Building Cash Flow Forecasts with Sales Data
A solid cash flow forecast is critical for securing favorable financing. By analyzing your weekly sales velocity, you can present a detailed view of your business’s financial health. This demonstrates to lenders that you manage your cash flow carefully.
Start with your Account Sales report to identify consistent revenue trends. Reviewing 13-week sales data can reveal both growth patterns and seasonality. Consistent growth in gross merchandise volume is a key sign of scalability. Comparing current sales to historical data can provide even deeper insights.
When creating your forecast, remember that Onramp Funds offers a flexible repayment structure tied to your actual sales. Payments are typically set at 1% of sales per cycle, adjusting automatically based on your performance - unlike fixed monthly payments.
"Onramp Funds, in particular, evaluates Walmart performance holistically - looking at how Walmart fits into the seller's total omnichannel revenue mix, not as an isolated channel." [1]
Avoid relying too heavily on short-term revenue spikes when forecasting. For example, if you had a strong holiday season, separate that data from your baseline to show year-round sustainability.
For high-volume sellers, consider using the Payment Reports API to pull reconciliation reports and transaction data automatically. This ensures your forecast is based on the most accurate and current financial data, boosting Onramp Funds’ confidence in your application. A well-prepared cash flow forecast not only shows funding readiness but also aligns repayment terms with your actual business performance.
sbb-itb-d7b5115
Strategies to Optimize Data for Better Financing Terms
Your Walmart Marketplace data is more than just numbers - it's a dynamic snapshot of your business's health. By strategically refining this data, you can secure larger funding amounts and better repayment terms. The key is to show lenders that your operations are stable and your revenue is predictable, which signals lower risk.
Improving Sales Performance for Higher Funding Offers
Lenders look for consistent weekly or monthly sales, so smoothing out revenue fluctuations is crucial. You can achieve this through smarter inventory planning and well-timed promotions.
Using Walmart Fulfillment Services (WFS) can also work to your advantage. WFS helps reduce shipping risks and customer disputes while opening doors to specialized financing programs like Capital for WFS [2]. These improvements not only boost your sales but also strengthen your position when applying for funding.
Higher sales volume often leads to better funding offers, as lenders are more inclined to provide larger advances to high-volume sellers [3]. To drive sales growth, consider using Walmart Sponsored Products to increase your product visibility. Another tactic is to raise your average transaction value by bundling related items or offering discounts on bulk purchases [3].
Leverage the Catalog Dashboard in Seller Center to identify trending products and analyze popularity data [3]. This tool helps you strategically expand your product catalog by adding high-potential SKUs, diversifying your revenue streams. Relying too heavily on a single product can be risky in the eyes of lenders, so spreading sales across multiple items is a smart move [1].
In addition to increasing sales, effective inventory management plays a critical role in improving your financing options.
Using Inventory Data for Flexible Repayment Plans
Strong inventory management reflects disciplined cash flow practices. High inventory turnover signals that you’re forecasting demand accurately and quickly converting stock into revenue [1]. Avoid the pitfalls of frequent stockouts, which can lead to missed sales opportunities, or overstocking, which ties up valuable capital.
Keeping your inventory balanced can also help you negotiate flexible repayment terms. For example, Onramp Funds structures repayments as a percentage of your sales - typically around 1% per payment cycle [3][5]. This approach ensures that your cash flow remains steady, even during slower sales periods, unlike rigid fixed payments.
"Reliable fulfillment directly impacts lender confidence because inventory-backed financing depends on fast, predictable conversion of stock into cash." – Onramp Funds [1]
If you’re fulfilling orders yourself, switching to WFS can enhance your delivery reliability and reduce customer disputes, strengthening your case for funding [1]. Regularly monitor your sell-through rates to maintain balanced stock levels and avoid the challenges of overstocking or missed revenue from stockouts [1].
Finally, diversifying your SKUs is another way to reduce risk. A broader product portfolio minimizes dependency on any single item, making your business more attractive to lenders [1].
Financing Options for Walmart Sellers
Choosing the right financing option can play a crucial role in driving your business growth. Each financing type comes with its own costs, repayment terms, and eligibility criteria, which can impact your cash flow and overall flexibility. For Walmart sellers, leveraging your marketplace data - such as consistent sales performance and operational reliability - can open doors to tailored financing solutions. Below, we break down three popular financing options that use Walmart Marketplace data to your advantage.
Merchant Cash Advance (MCA) gives you an upfront lump sum, with repayments automatically deducted as a percentage of your daily or weekly sales. Walmart Marketplace Capital offers this option through programs like Capital by Parafin. To qualify, you’ll need at least six months of sales history, a U.S. TIN, and compliance with Seller Performance Standards [2]. While MCAs provide quick access to funds, they come with high costs - factor rates around 1.1 can result in effective APRs exceeding 20%, especially during slower sales periods [4].
Lines of Credit allow you to borrow up to a set limit and only pay interest on the amount you use. These are ideal for sellers with at least one year in business and $100,000 or more in annual revenue [16]. This option is particularly helpful for managing seasonal cash flow or handling unexpected expenses, but it does require fixed monthly payments [4].
Revenue-Based Financing (RBF) ties your repayments directly to your sales, making it a flexible option for sellers who rely on marketplace data. Providers like Onramp Funds offer RBF with fixed fees ranging from 2–8%, and repayments are structured as a percentage of your monthly revenue - typically about 1% per payment cycle [3][5]. This model ensures that repayment amounts align with your sales performance.
Comparison Table of Financing Types
Here’s a quick overview of the key features of each financing option:
| Financing Type | Fees/Costs | Repayment Method | Ideal for Walmart Sellers | Example Providers |
|---|---|---|---|---|
| Merchant Cash Advance | Factor rate ~1.1 (10% fee); effective APR 20–100%+ | Percentage of daily/weekly sales until advance repaid | High-volume sellers needing immediate cash despite sales volatility | Walmart Capital by Parafin [2] |
| Line of Credit | Interest on drawn amount (10–60% APR) | Fixed monthly payments or on-demand | Sellers managing seasonal cash flow gaps or covering unexpected costs | Slope (for $100K+ revenue sellers) [16] |
| Revenue-Based Financing | 2–8% fixed fee | Percentage of monthly revenue until fixed amount repaid | Data-driven sellers using Walmart metrics for forecasting and flexibility | Onramp Funds [15] |
For Walmart sellers with a strong track record - consistent sales, reliable inventory turnover, and predictable customer behavior - revenue-based financing stands out as a particularly appealing choice. This option leverages your performance metrics to determine funding eligibility and offers terms that align with your business's sales cycles, ensuring you’re not overextended during slower months.
"Our mission is to ensure sellers have the capital they need to keep product in stock and their customers happy. We're here to make that happen." – Eric Youngstrom, Founder of Onramp Funds [5]
Conclusion
Walmart Marketplace data plays a key role in unlocking flexible financing options geared toward growth. By analyzing sales trends, inventory turnover, and customer behavior, you can paint a clear picture of your business’s financial health - exactly the kind of insight lenders like Onramp Funds rely on. Instead of traditional credit checks, this performance-based approach evaluates real-time data, often leading to funding approvals within 24 hours. The funding amounts are tied directly to your revenue potential, giving you access to capital that reflects your business’s actual performance.
Accurate and transparent data gives you an edge when seeking funding. Maintaining consistent sales, managing inventory efficiently, and ensuring reliable fulfillment can lead to better financing terms. Onramp Funds’ revenue-based model also provides flexibility, with repayments that automatically adjust to your sales. This means you won’t feel overburdened during slower periods. Managing your marketplace data strategically not only boosts your funding prospects but also aligns your capital with your business’s growth trajectory.
For Walmart sellers generating at least $3,000 in monthly sales, incorporating marketplace data into financial planning can unlock funding that grows with your business. Whether you’re preparing for the holiday rush or expanding your product lineup, leveraging performance metrics allows you to secure funding without the constraints of rigid loan terms.
"Our mission is to ensure sellers have the capital they need to keep product in stock and their customers happy. We're here to make that happen." – Eric Youngstrom, Founder of Onramp Funds
Keep an eye on your Seller Center dashboard, use historical sales data to forecast cash flow, and harness your performance metrics to secure the right funding. The better your data, the stronger your financial foundation for scaling your business.
FAQs
Which Walmart metrics matter most for funding approval?
When seeking funding approval, Walmart sellers should focus on three critical metrics: revenue stability, sales performance, and fulfillment reliability.
- Revenue stability: Consistent weekly or monthly sales indicate steady demand, which reassures lenders or investors about the predictability of your business.
- Sales performance: Strong sales figures and efficient inventory turnover demonstrate operational efficiency and the ability to meet customer demand effectively.
- Fulfillment reliability: Sellers using Walmart Fulfillment Services (WFS) often have an edge. WFS enhances delivery speed and boosts customer satisfaction, which can positively influence how funders view your business.
Together, these metrics paint a picture of a business with predictable revenue and dependable operations - key elements for securing funding.
How can I show stable cash flow if my sales are seasonal?
To keep cash flow steady despite seasonal sales fluctuations, start by diving into historical sales data. This can help you identify patterns and predict future trends. With this insight, you can craft strategies to even out cash inflows during slower months.
Another smart move is building up cash reserves that can cover 3–6 months of your operating expenses. This cushion can act as a safety net when sales dip. Additionally, exploring financing options like revenue-based funding can provide extra support, helping you bridge financial gaps when business slows down.
These steps can go a long way in ensuring your finances stay on track throughout the year.
What Walmart Seller Center reports should I export for my application?
To make your funding application more compelling, consider exporting essential reports from Walmart Seller Center that highlight your sales and financial performance. Start with the Marketplace and WFS Payment Report, which provides detailed transaction data and showcases consistent revenue streams. Next, use the Account Sales Report and Item Sales Report to present key metrics like sales trends, gross merchandise value (GMV), and inventory turnover. These reports can effectively illustrate steady growth, dependable operations, and your readiness for funding, giving potential lenders the confidence they need.
