
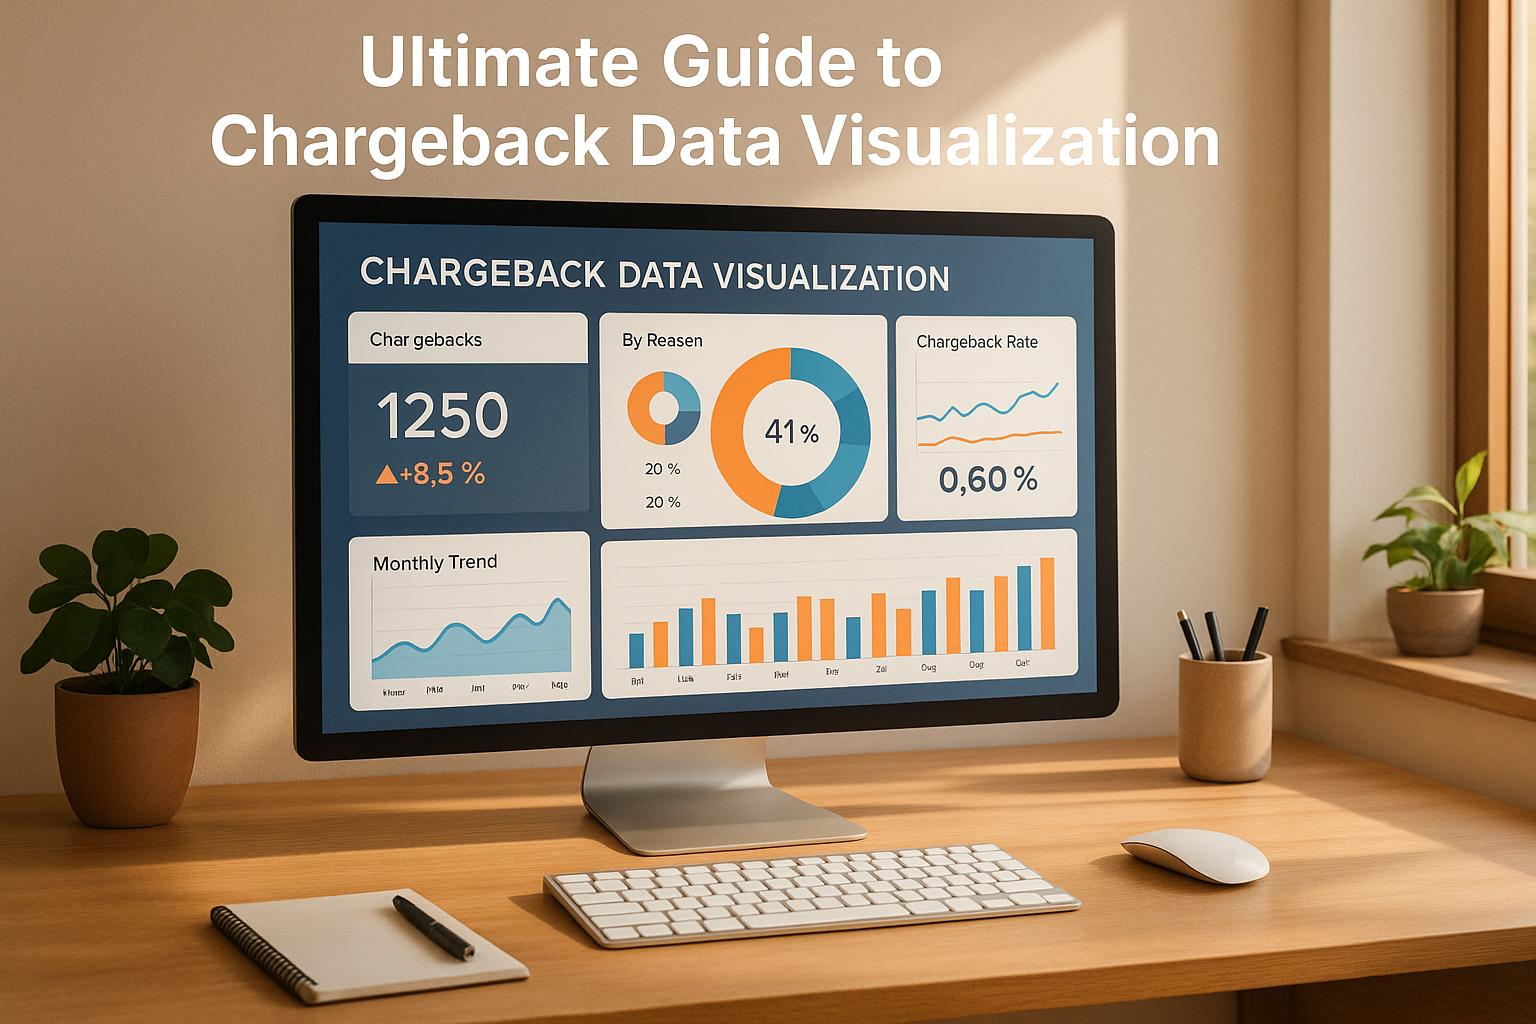
Visualizing chargeback data can help businesses reduce risks, spot fraud patterns, and save money. By using tools like dashboards and charts, companies can track key metrics such as chargeback rates, fraud-to-sales ratios, and seasonal trends in real time. This leads to smarter decisions and better financial outcomes.
Key takeaways:
- Core Metrics to Track: Keep chargeback rates below 1%, authorization rates above 90%, and fraud-to-sales ratios under 1%.
- Seasonal Trends: Chargebacks often spike during peak seasons (e.g., Q1 for travel and e-commerce).
- Visualization Tools: Use line charts for trends, heat maps for high-risk areas, and bar charts for category comparisons.
- Real-Time Insights: Connect platforms through APIs for automated data collection and live monitoring.
- ROI Example: Preventing one chargeback can save up to $190, highlighting the importance of proactive management.
Quick Tip: Start with a simple dashboard that tracks your most critical metrics and set alerts for unusual activity. This can help you act quickly and minimize losses.
Core Chargeback Metrics
Key Chargeback Metrics to Watch
Keeping an eye on critical chargeback metrics is essential for smooth payment operations. Metrics like chargeback rate, authorization rate, and fraud-to-sales ratio are especially important. A dashboard that tracks these in real time can help businesses address potential issues before they escalate into costly disputes.
| Metric | Target Range | Business Impact |
|---|---|---|
| Chargeback Rate | Below 1% | Avoid penalties from payment processors and maintain account status |
| Authorization Rate | Above 90% | Boost revenue and lower cart abandonment rates |
| Fraud-to-Sales Ratio | Below 1% | Reduce losses and build customer trust |
"The way you manage payments plays a big role in whether your business thrives or struggles. Customers expect a smooth, secure, and hassle-free checkout experience, and the effectiveness of your payment processing system is key to delivering that." - CatalystPay [6]
On average, each dispute costs around $190, making it crucial to monitor these metrics closely [5]. Dashboards should be designed to clearly display trends and flag issues early. Beyond these foundational metrics, tracking seasonal trends can provide deeper insights into chargeback patterns.
Seasonal and Monthly Trends
Seasonal trends often reveal periods of increased chargeback activity. For instance, the travel and lodging industry saw an 816% spike in chargebacks during Q1 2023 compared to the previous year, while e-commerce experienced a 222% rise during the same period [7]. Additionally, digital fraud losses are expected to hit $48 billion in 2024 [7].
To tackle these trends effectively:
- Review historical data to anticipate high-risk periods
- Strengthen fraud prevention efforts during peak seasons
- Adjust staffing levels to manage increased dispute volumes
- Set up alerts to detect unusual spikes in activity
These proactive measures can help businesses stay ahead of seasonal fluctuations and minimize disputes.
Geographic and Product-Specific Insights
Analyzing chargeback data by location and product category allows businesses to develop targeted strategies for prevention. Current data shows that friendly fraud accounts for 60–80% of chargebacks, while criminal fraud makes up about 30% [5].
Key areas to analyze include:
- High-risk regions: Certain locations may require stricter verification processes.
- Products linked to friendly fraud: Identify items frequently involved in disputes.
- Marketing channel correlations: Determine if specific channels are linked to higher chargeback rates.
- Seasonal trends by region or product: Spot unique patterns tied to geography or product types.
Visualization tools like heat maps and scatter plots are particularly effective for highlighting problem areas. These insights enable businesses to act quickly, addressing issues before they escalate into larger challenges.
Data Visualization Methods
Top Visualization Software Options
Using data visualization tools can simplify chargeback analysis by uncovering patterns in disputes and detecting fraud trends. Research shows these tools help identify key issues early, allowing businesses to take preventive action [3].
| Tool Type | Primary Use Cases | Features |
|---|---|---|
| Business Intelligence | Enterprise-level analysis | Real-time dashboards, predictive analytics |
| Spreadsheet Tools | Basic trend analysis | Custom charts, pivot tables |
| API-Based Solutions | Platform integration | Automated data collection, custom reporting |
Chart Types and Uses
Choosing the right chart type can make chargeback data more understandable and actionable.
- Line Charts: Ideal for tracking chargeback trends over time. They highlight month-over-month changes and help spot unusual spikes in disputes.
-
Heat Maps: Great for visualizing high-risk areas. They can show regions, timeframes, or product categories most affected by fraud or disputes.
"Effective visualization can be a useful tool in identifying areas of financial information that require additional substantive testing." – Lauren Cunningham and Sarah Stein [4]
- Bar Charts: Perfect for comparing categories. These charts can help analyze chargeback reason codes, evaluate payment processor performance, or assess disputes tied to specific products.
Each chart type plays a role in making complex data easier to interpret and supports efforts to combine insights from various sources.
Platform Data Connections
For real-time monitoring, connect data from major eCommerce platforms using APIs. This integration allows businesses to stay updated and act quickly.
Key integration features include:
- Automated data collection with standardized formats
- Real-time synchronization for up-to-date insights
- Secure protocols for safe data sharing
With U.S. merchants projected to lose $13.8 billion to chargebacks by 2025 [8], leveraging effective data visualization and seamless integration becomes a crucial part of managing risks and minimizing losses.
Chargebacks911 New and Improved Client Portal
sbb-itb-d7b5115
Setting Up Visualization Systems
To make the most of your analysis and visualization efforts, it's critical to establish a system that's both reliable and secure. This ensures you can turn data into meaningful insights effectively.
Real-Time Data Pipeline Setup
A well-structured data pipeline is the backbone of chargeback visualization. It brings together data from various sources, standardizes it, and enables real-time visualization.
Here’s a breakdown of the key components:
| Pipeline Component | Key Requirements | Implementation Focus |
|---|---|---|
| Data Sources | Payment processors, eCommerce platforms | Automated collection and standardization |
| Storage Solution | Data warehouse, cloud storage | Secure access and scalability |
| Processing Layer | ETL workflows, data transformation | Real-time updates and data quality |
| Visualization Layer | Dashboard tools, reporting systems | User-friendly access and customization |
"The data quality and data freshness of Stripe Data Pipeline are a departure from third-party ETL pipeline vendors. Data imported through Stripe Data Pipeline always matches our reports exactly." - Lime [9]
Once your pipeline is set up, ensure your reporting tools are configured to quickly address any issues as they arise.
Report and Alert Systems
Set up your platform to send real-time alerts for critical events such as sudden increases in chargebacks, unusual geographic trends, high-risk patterns, or product-specific anomalies. Use customized dashboards and automated reports to keep an eye on these key metrics at all times.
Data Protection Standards
After your reporting systems are in place, focus on safeguarding your data pipeline by adhering to strict security measures:
- Use role-based access controls with multi-factor authentication.
- Ensure compliance with PCI DSS and conduct regular privacy assessments.
- Apply strong encryption, perform routine audits, and maintain detailed logs of system access.
"Lawyers must ensure that data is regularly backed up and that secure access to the backup data is readily available in the event of a data loss." - American Bar Association (ABA) Formal Opinion 498 [10]
Financial Performance Improvement
Once you have a visualization system in place, the next step is putting those insights to work to improve your financial outcomes.
Prevention Strategy ROI
Understanding the return on investment (ROI) of your prevention strategies is crucial. Without proper documentation, merchants can face costs as high as $240 for every $100 in chargebacks [11]. Real-time data visualization can help pinpoint which strategies are most effective. For example, Kount shared a case where a merchant identified an unusually high chargeback rate tied to a specific social media platform. By analyzing the data and shifting to age-targeted marketing, they were able to significantly lower their chargeback risk [1].
Resource Planning
Efficient resource allocation begins with knowing where chargebacks originate and which areas need immediate attention. Visualization tools can spotlight high-priority segments, helping you make informed decisions about systems and staffing.
Key areas to address include:
- Transaction Monitoring: Adjust staffing levels to handle peak dispute periods effectively.
- Dispute Resolution: Assign your most skilled team members to handle high-value cases.
- Documentation Systems: Enhance tools for collecting and organizing evidence.
- Training Programs: Use insights from data visualization to create focused training initiatives.
These adjustments lay the groundwork for better cash flow management and operational efficiency.
Cash Flow Planning
With global chargeback volumes projected to increase by 40% by 2026 [13], managing cash flow becomes even more critical. Visualization tools can assist by:
- Tracking Impact: Predict chargeback trends and keep tabs on payment cycles.
- Managing Reserves: Ensure you have sufficient funds available based on dispute patterns.
- Assessing Risk: Identify high-risk periods so you can plan ahead.
In 2023, chargebacks cost U.S. merchants a staggering $243 billion [12]. For eCommerce businesses, these insights are essential for sound financial planning. Platforms like Onramp Funds provide equity-free financing to help maintain steady cash flow during chargeback spikes, ensuring businesses can navigate these challenges effectively.
Conclusion
Main Points Review
Data visualization plays a key role in simplifying chargeback management by uncovering patterns and trends that support proactive decision-making. Effective visualization tools provide real-time insights, helping businesses prevent chargebacks and manage costs more efficiently. Modern tools empower a forward-thinking approach to handling chargebacks, making it easier to stay ahead of potential issues [3]. Below is a practical guide to help you integrate these insights into your strategy.
Implementation Guide
To successfully implement chargeback visualization, consider these steps:
- Set Clear Metrics: Identify specific goals and measurable outcomes for your visualization efforts. Prioritize key performance indicators (KPIs) that directly influence your chargeback prevention strategy [3].
- Select the Right Tools: Choose tools that fit your business needs, keeping in mind factors like data volume, complexity, and the requirements of your stakeholders. Ensure the tools integrate seamlessly with your current systems and provide real-time data access [3].
- Ensure Data Accuracy: Regularly clean and organize your data to maintain high-quality visualizations. Implement processes that guarantee accuracy and consistency across all data channels [3].
These steps build on proven strategies to reduce chargeback risks and improve financial outcomes. Regular monitoring and updates to your visualization practices will help maintain and enhance your chargeback prevention efforts [2].
For eCommerce businesses, combining these visualization practices with Onramp Funds' tailored financing solutions can offer an additional boost to financial stability.
FAQs
How can businesses use data visualization to detect and prevent chargeback fraud?
Businesses can tap into the power of data visualization to spot and combat chargeback fraud by analyzing transaction patterns and pinpointing the triggers behind disputes. Tools like bar charts and heat maps simplify the process of identifying trends, such as frequent chargeback reasons or periods when risks are heightened. This allows merchants to tackle recurring problems like incorrect billing or shipping delays before they escalate. Chargeback dashboards that highlight reason codes, chargeback ratios, and dispute win rates can help uncover root causes of revenue loss and improve chargeback management strategies. With these insights in hand, businesses can take specific actions to curb fraud, such as enhancing transaction verification systems or keeping a closer eye on high-risk product categories. Data visualization empowers businesses to make smart, data-backed decisions that help reduce chargebacks and safeguard their revenue. By visualizing transaction data across payment processors and card networks, businesses can streamline dispute resolution and collaborate more effectively with issuing banks.
How can I set up a real-time data pipeline to monitor chargebacks effectively?
To build a real-time data pipeline for monitoring chargebacks, start by utilizing cloud platforms like AWS or Google Cloud. These platforms provide the scalability and dependability needed for handling large volumes of transactions. Tools like Apache Kafka are excellent for enabling real-time transaction processing, allowing you to monitor chargebacks as they occur. For long-term analysis, store historical data securely in systems such as Amazon S3 or a relational database.
This kind of setup supports automation and optimization of your chargeback process by integrating data analytics and predictive models into your fraud prevention workflow.
Integrate machine learning models into your pipeline to spot unusual transaction patterns and flag potential fraud early. Keep a close eye on key metrics like chargeback ratios and dispute win rates through dynamic dashboards that update in real time. This approach equips you to act quickly on emerging trends, helping to reduce chargebacks and enhance overall performance.
Monitoring chargeback data in real time allows eCommerce businesses to take proactive steps against friendly fraud and unauthorized credit card disputes.
How do seasonal trends affect chargeback rates**, and what can businesses do to reduce their impact?**
Seasonal trends - especially during high-traffic shopping times like the holiday season - often bring a spike in chargeback rates. This happens for several reasons: increased transaction volumes, more fraud attempts, disputes over unclear product descriptions, and delays in shipping. For instance, during the holiday season of 2023, chargebacks saw a noticeable uptick compared to other times of the year.
To combat these challenges, businesses can take a few practical steps:
- Strengthen fraud detection tools to identify and block suspicious transactions early.
- Clearly outline return and refund policies to manage customer expectations upfront.
- Ensure product descriptions are precise and shipping timelines are realistic to avoid misunderstandings.
- Boost customer service efforts to resolve potential complaints before they escalate into disputes.
By adopting these measures, businesses can not only keep chargeback rates in check but also foster trust and loyalty with their customers during busy seasons.
