
Key Takeaways:
- Inventory turnover ratio: Measures how often stock is sold and replaced. A good range for most eCommerce businesses is 4–6 times per year.
- Days Inventory Outstanding (DIO): Shows how long inventory stays unsold. Lower DIO means faster sales cycles.
- Forecasting methods: Use historical sales data, seasonal trends, and advanced tools like ARIMA or real-time demand sensing for accurate predictions.
- Common challenges: Demand volatility, data silos, and external disruptions can complicate forecasting.
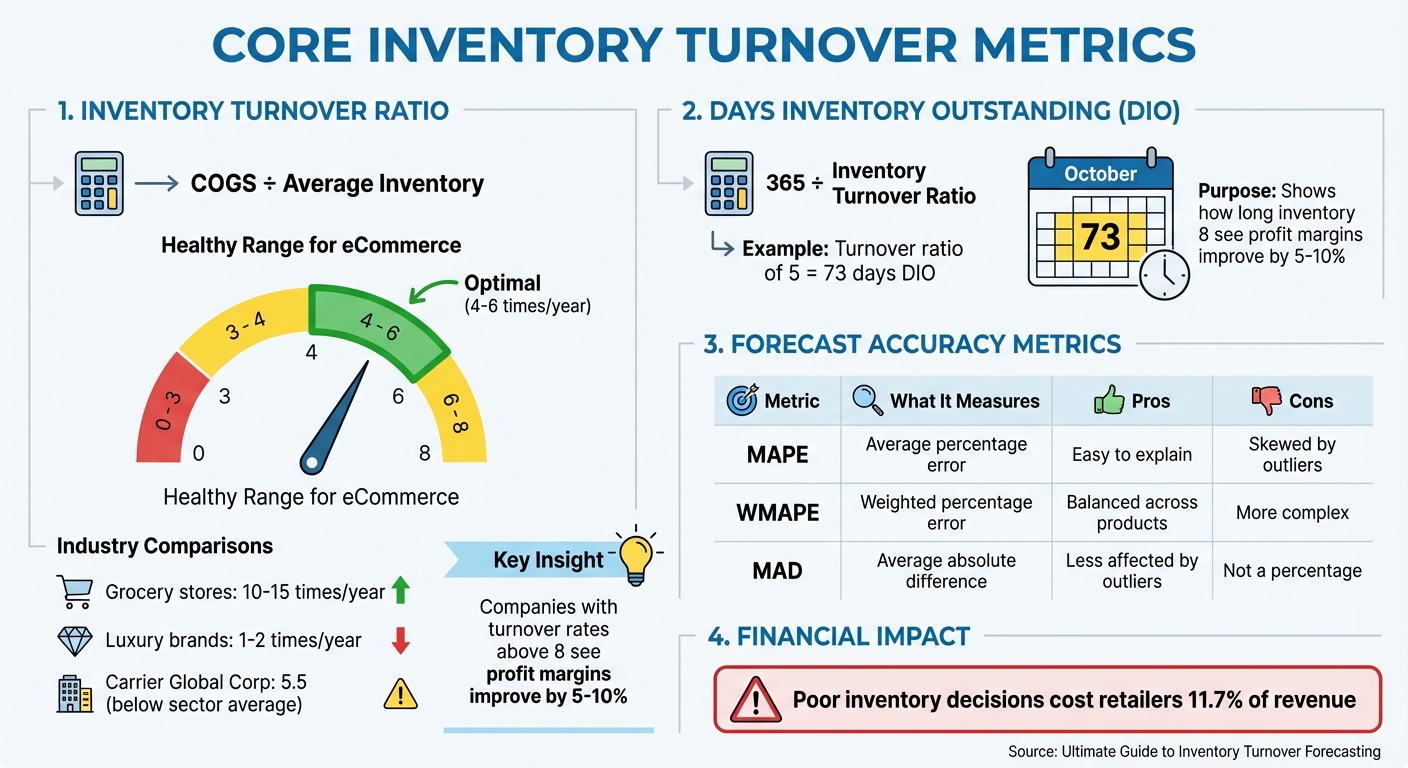
- Financial impact: Poor inventory decisions cost retailers 11.7% of revenue. Accurate forecasting can reduce stockouts, overstocks, and markdown costs.
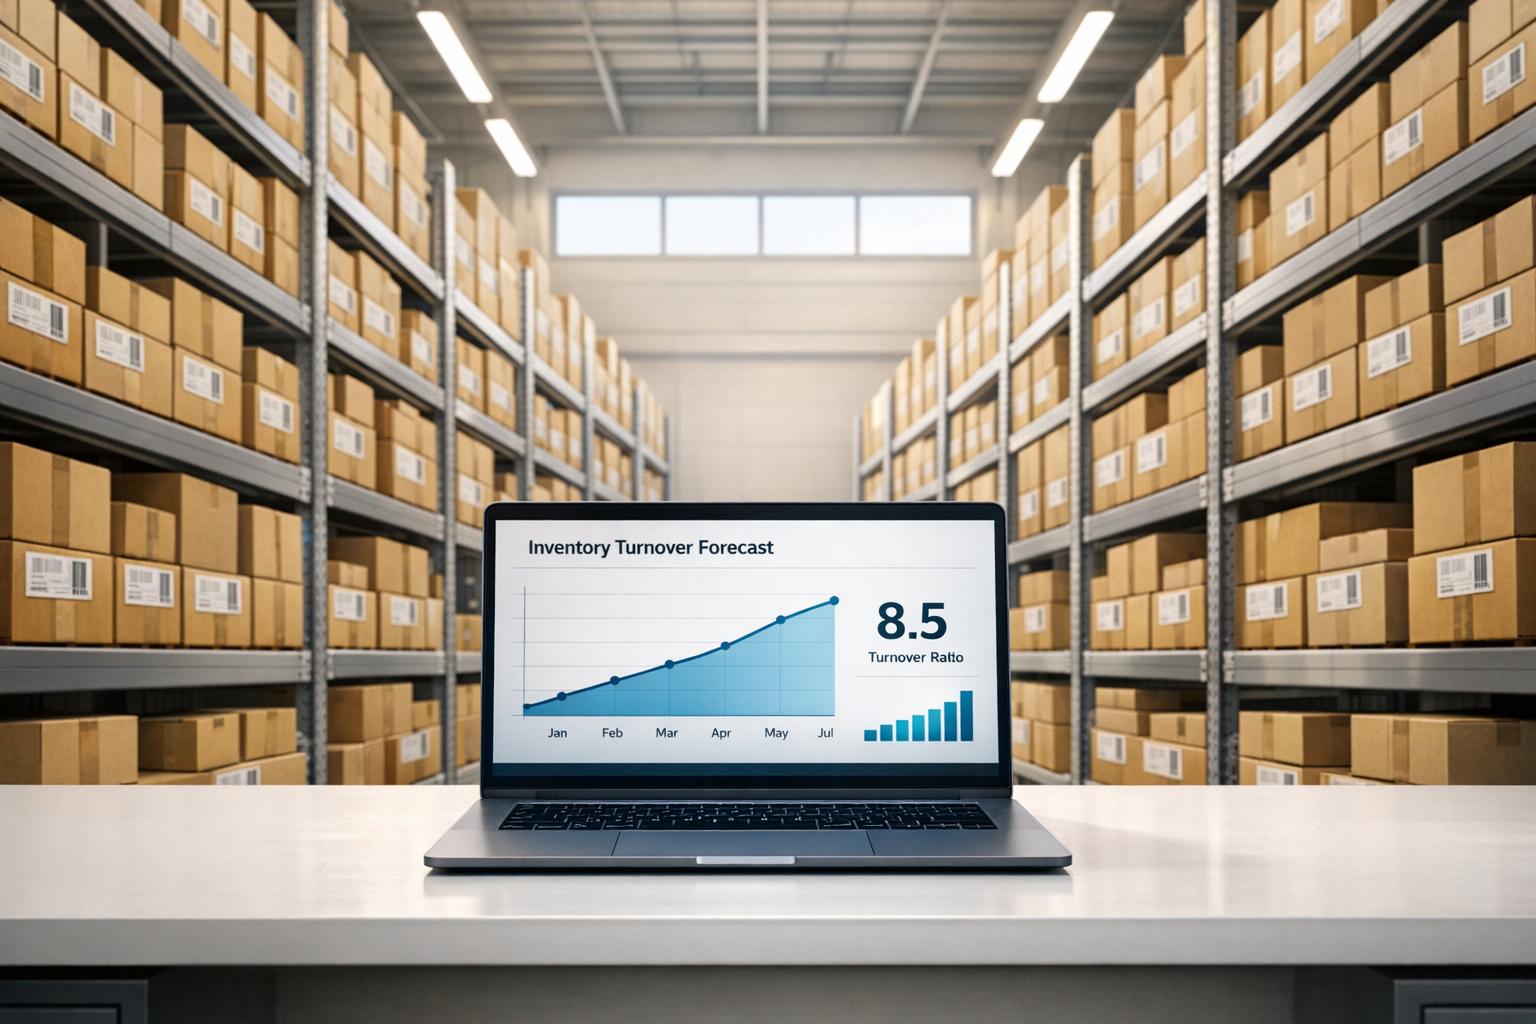
Why it matters: With eCommerce sales growing, businesses that optimize inventory can cut costs, improve efficiency, and boost revenue. Let’s dive into the metrics, methods, and tools you can use to master inventory turnover forecasting.
Inventory Target 📦🎯: Step-By-Step Forecasting Tutorial with examples (inventory budget)
sbb-itb-d7b5115
Core Metrics for Inventory Turnover Forecasting
Key Inventory Turnover Metrics and Benchmarks for eCommerce
When it comes to inventory turnover forecasting, tracking the right metrics can transform guesswork into informed decision-making. Three key metrics form the foundation for better management of stock levels and cash flow: the Inventory Turnover Ratio, Days Inventory Outstanding (DIO), and forecast accuracy metrics. Each plays a unique role in ensuring your inventory strategy aligns with business goals.
Inventory Turnover Ratio
The Inventory Turnover Ratio measures how often your inventory is replaced over a specific period. To get an accurate picture, use Cost of Goods Sold (COGS) instead of revenue, as including profit margins can distort results. The formula for COGS is:
Beginning Inventory + Purchases - Ending Inventory.
For Average Inventory, add the beginning and ending inventory values, then divide by two. This approach smooths out fluctuations caused by seasonal trends or bulk purchases [1][2][3].
Turnover rates vary significantly by industry. For instance, grocery stores often have ratios between 10–15 due to their fast-moving goods, while luxury brands may only turn inventory 1–2 times a year [1][4]. Carrier Global Corporation, for example, reported a turnover ratio of 5.5, which analysts noted was below its sector average [4]. Companies with turnover rates above 8 often see profit margins improve by 5–10% [3]. However, excessively high turnover can indicate under-stocking, leading to missed sales opportunities.
"A healthy inventory turnover ratio means your products are selling like hotcakes, cash is flowing, and you're not wasting money on storage for slow-moving stock." - Chilat Doina, Million Dollar Sellers [4]
Mastering this ratio helps you assess operational efficiency, but for more detailed planning, DIO provides a clearer timeline.
Days Inventory Outstanding (DIO)
DIO calculates how many days inventory remains unsold. It’s derived by dividing 365 by the turnover ratio. For example, a turnover ratio of 5 translates to a DIO of 73 days [1][2].
This metric is especially helpful for operational planning, such as setting reorder points, managing supplier lead times, and determining safety stock levels [2][5]. While the turnover ratio gives a big-picture view and serves as a benchmark, DIO breaks it down into a practical timeline that’s easier to apply in daily operations. Many businesses prefer working with DIO for this reason - it’s more intuitive when planning around specific dates and deadlines [2].
Forecast Accuracy Metrics
Accurate forecasting is the backbone of inventory management. Metrics like MAPE, WMAPE, and MAD provide insights into how well your forecasts align with reality, helping you refine your approach.
- Mean Absolute Percentage Error (MAPE): This metric calculates the average percentage error, making it straightforward to explain to stakeholders. However, it can be skewed by outliers or periods with very low demand [6].
- Weighted Mean Absolute Percentage Error (WMAPE): WMAPE improves on MAPE by factoring in total demand, reducing the impact of low-demand periods. For example, if you forecast 1,000 units but sell 900, your 10% error is weighted against overall sales volume, offering a more balanced view across all products [6].
- Mean Absolute Deviation (MAD): Unlike MAPE, MAD measures the average absolute difference between forecasted and actual values. It’s less affected by outliers but may be harder to interpret since it’s not expressed as a percentage [6].
To ensure data accuracy, align the timeframes for COGS and average inventory calculations [1][3]. By leveraging these metrics, you can make precise adjustments that support both short-term decisions and long-term growth, keeping your inventory strategy aligned with your business objectives.
Inventory Turnover Forecasting Methods
To turn raw data into actionable inventory strategies, it's essential to choose forecasting methods that align with your business's stage, available data, and market conditions. Many eCommerce sellers find success by combining numerical analysis with human insights, striking a balance between avoiding stockouts and preventing overstocking. The right forecasting method can help streamline inventory turnover and fuel growth.
Trend and Seasonal Forecasting
Trend forecasting relies on analyzing at least two years of historical sales data to predict future demand [8]. This method operates on two levels: long-term trends, which track broader market shifts like the rising demand for organic products, and short-term seasonal trends, which focus on spikes during specific periods such as Black Friday, back-to-school season, or weather-driven demand [8].
When preparing for seasonal peaks, use the same period from the previous year as a baseline. Adjust forecasts accordingly - if you ran a large marketing campaign last November but don’t plan to repeat it, reduce your projections to avoid overstocking [8]. To quantify seasonal demand, calculate a seasonal index: Average Sales for a Period ÷ Overall Average Sales [7].
Also, be mindful of stockouts when calculating demand. For example, if a product was out of stock for 10 days during a 30-day period, dividing total sales by 30 would underestimate actual demand [9]. For new products, you can apply the analog method, which uses data from similar items to estimate demand [7][9].
Quantitative Forecasting
Quantitative forecasting focuses on statistical models that identify patterns in numerical data. One common technique is the Simple Moving Average (SMA), which calculates the average sales over a set number of periods - ideal for products with steady demand [11][12]. Another is exponential smoothing, which gives more weight to recent sales trends using the formula: α(Current Sales) + (1 – α)(Previous Forecast), where α determines the importance of recent data [11][12].
For products with clear seasonal patterns, ARIMA (AutoRegressive Integrated Moving Average) offers a more advanced statistical approach to uncover recurring trends [11]. Before applying these methods, clean your data by removing unusual spikes, such as one-off bulk orders or anomalies like pandemic-driven demand surges [7].
"Inventory forecasting is the data-driven process of estimating how much stock you'll need over a future period so you can meet customer demand without over-ordering." - Steve Rajeckas, Content Marketing Manager, Red Stag Fulfillment [7]
Consider the success story of Luna & Co. Leather Goods. By late 2025, the company managed over 300 SKUs across multiple warehouses and sales channels. After implementing automated forecasting with weekly updates, they reduced stockouts by 40%, cut average inventory days by 28%, and boosted quarterly revenue by 12% [10].
Qualitative Forecasting
While quantitative models excel with large datasets, qualitative forecasting adds context where numbers alone fall short. This approach is particularly useful when historical data is limited. It relies on expert opinions, market research, and methods like the Delphi method, where a panel of experts independently provides forecasts that are then aggregated [11][10].
Qualitative forecasting shines when launching new products or entering uncharted markets. It captures factors like competitive dynamics and emerging trends that algorithms might overlook [11][9]. However, this method is labor-intensive, less scalable, and more susceptible to bias compared to quantitative models [11].
Many businesses adopt a hybrid approach, blending the precision of quantitative methods with the adaptability of qualitative insights [11][9]. For instance, segment your SKUs into fast, medium, and slow movers, and apply tailored forecasting rules to each group. This strategy helps balance inventory turnover while minimizing the risk of stockouts [2].
Advanced Forecasting Techniques
Advanced forecasting methods refine predictions and help minimize costly errors. These strategies break down historical data, automate critical decisions around inventory, and incorporate live sales data to keep forecasts aligned with current trends.
Time-Series Analysis and SKU-Level Forecasting
Time-series analysis dissects sales data into three main components: Trend (long-term patterns), Seasonality (recurring fluctuations like holiday peaks), and Noise (random variations from unexpected events)[13]. By isolating these elements, businesses can predict demand with greater precision than using averages alone.
Focusing on SKU-level forecasting avoids the pitfalls of a "one-size-fits-all" approach. For example, high-demand products might need weekly reorders, while slower-moving items can operate on monthly cycles[2]. Advanced models such as ARIMA can be tailored to SKU-specific sales patterns, while Exponential Smoothing adjusts well to changing trends and seasonal shifts[13].
Consider this: a fashion retailer reduced overstock by 30% and boosted sales by 20% by using time-series forecasting. Similarly, an electronics retailer optimized inventory by 25% and improved profit margins by 15% after implementing ARIMA and Prophet models[13].
"Time series forecasting has emerged as a vital tool that empowers businesses to make informed decisions about their stock levels." - Pingax[13]
With these insights, businesses can establish precise reorder points and integrate real-time data for even more accurate forecasting.
Reorder Point and Safety Stock Calculations
Once demand is forecasted, attention shifts to managing replenishment effectively. The Reorder Point (ROP) formula is:
(Average Daily Sales × Lead Time) + Safety Stock[15].
Safety Stock acts as a cushion against uncertainties. It’s calculated as:
(Maximum Daily Sales × Maximum Lead Time) – (Average Daily Sales × Average Lead Time)[8].
Here’s an example: If your average daily sales are 50 units with a 10-day lead time (500 units total), and your maximum daily sales are 80 units over a 14-day lead time, safety stock would be (80×14) – (50×10) = 1,120 – 500 = 620 units. This means your reorder point would be 1,120 units.
Using actual delivery data (instead of supplier estimates) ensures accuracy[15]. For stable products, analyze 60–90 days of sales data. For seasonal items, compare the same period from the previous year[16]. Additionally, segment SKUs by velocity - fast movers need higher reorder points and closer monitoring, while slow movers can maintain lower buffers[2].
"Stockouts don't happen because businesses forget to reorder. They happen because they reorder too late." - Bhoomi Singh, Sumtracker[16]
Regularly review these thresholds - every 30–60 days - to adapt to shifts in demand or supplier performance[16]. If your business is growing quickly, adjust average daily sales figures to include projected growth rates[17].
Real-Time Data Integration
Traditional forecasting often struggles to keep up with sudden market changes. Real-time data integration bridges this gap by using live sales data from eCommerce platforms to adjust forecasts dynamically[18]. This method, called demand sensing, incorporates near-real-time signals like orders, POS data, and promotional activity to fine-tune short-term forecasts[18].
By synchronizing inventory across channels, businesses can avoid overstocking in one area while running out in another[10]. Automated systems can trigger reorder points based on current sales velocity rather than static historical data[10]. Additionally, aligning forecasts with upcoming promotions or marketing campaigns prevents artificial stockouts during peak demand[8].
| Aspect | Traditional Forecasting | Demand Sensing (Real-Time) |
|---|---|---|
| Data Used | Historical sales and purchase history | Live signals from orders, POS, and promotions |
| Forecast Horizon | Medium to long term (months, quarters) | Short term (days, weeks) |
| Responsiveness | Limited; slower to react to changes | High; adapts quickly to shifts |
| Best Use Case | Stable SKUs and long-term plans | Volatile SKUs needing quick adjustments |
"The most resilient planning process often combines both: demand sensing for short-term agility and traditional forecasting for medium-term stability." - Bani Kaur, Content Marketing Specialist, Prediko[18]
Switch to rolling forecasts - a continuously updated 12-week window - to capture trends and anomalies as they emerge, rather than relying on static annual plans[10]. Track real-time lead times to dynamically adjust safety stock buffers[7]. Tools like Prediko (starting at $49/month)[18] and Sumtracker (starting at approximately $49/month)[14] can automate these processes, even flagging "Buy Now" alerts when stock reaches critical levels.
These advanced methods complement earlier strategies to create a robust forecasting system designed for eCommerce growth.
Optimizing Inventory Turnover Forecasts for Growth
How to Create and Validate Forecasts
To create accurate forecasts, start by analyzing at least 12 months of SKU-level data. Look for patterns like seasonality and demand shifts. For example, time-series analysis can reveal long-term trends and recurring spikes, such as holiday sales surges [6][20]. For established businesses, rely on quantitative methods, or use exponential smoothing to emphasize recent sales, ensuring your forecasts adapt to current market trends [20][22].
Validation is key. Use metrics like WMAPE (Weighted Mean Absolute Percentage Error) to measure forecast accuracy [6]. If your actual Days Inventory Outstanding (DIO) exceeds predictions by 20%, it’s time to recalibrate your model [6][20].
Keep an eye on critical KPIs, including the Inventory Turnover Ratio (COGS ÷ Average Inventory), DIO, and forecast accuracy. Review forecasts every 30–60 days using real-time ERP data to identify potential issues early [20][21][23][24]. SKU-level velocity reports, which track daily turnover and days on hand, can help fine-tune reorder points, preventing both stockouts and overstock [21][24]. Achieving forecast accuracy within ±5% of actual demand can unlock over 20% of working capital by reducing excess inventory and shortages [19].
Once your forecasts are validated, you can confidently use them to secure financing for growth.
Using Financing to Scale Inventory
Accurate forecasting doesn’t just streamline inventory - it also opens doors to scalable financing options. By freeing up working capital, you can make strategic inventory investments. For example, revenue-based financing offers equity-free capital that’s repaid based on a percentage of sales instead of fixed monthly payments. Companies like Onramp Funds specialize in funding eCommerce businesses on platforms like Amazon, Shopify, Walmart Marketplace, and TikTok Shop, with repayment rates typically ranging from 10% to 25% of daily revenue [19].
Let’s say your forecast predicts a 30% growth in Q4. You could secure $50,000 to bulk-purchase inventory 60 days before peak sales. This approach not only locks in volume discounts but also keeps your finances flexible [19]. Since repayments adjust with your sales velocity, slower months mean lower payments. Focus on investing in your top-margin SKUs and aim to finance 40%–60% of your orders [19].
Keep tabs on your Gross Profit Return on Inventory (GPROI), calculated as Gross Profit ÷ Average Inventory Cost. If GPROI improves after forecast adjustments and financing, it’s a signal to reinvest in scaling your operations further [19]. Onramp Funds simplifies financing by using real-time sales data, making it accessible for businesses with monthly sales of $3,000 or more.
Adjusting for Seasonality and Business Models
Seasonal spikes, like Black Friday, call for increased safety stock - boost buffers by 30%–50% during these periods [6][20]. A 12-month cash flow calendar that highlights pre-order periods, peak sales months, and clearance windows can help align inventory purchases with actual demand [19].
Different fulfillment models require tailored forecasting. For Amazon FBA, account for longer lead times and higher safety stock due to storage fees. Adjust your calculations for wholesale case packs and multi-warehouse tracking [20][24]. Dropshipping, on the other hand, benefits from velocity-focused forecasting to minimize holding costs while factoring in supplier lead times and real-time demand [23][24].
SKU-level trends can also guide stock placement. Fast-moving items may need higher reorder points and closer monitoring, while slower-moving products can maintain smaller safety buffers [21][24]. If you’re running a DTC brand selling individual units, your forecasting needs will differ from a wholesale operation shipping in bulk. Bundling strategies - like pairing slow-moving inventory with popular items at a 10% discount - can boost Average Order Value (AOV) and clear excess stock [19].
Consistently refine your forecasts and adjust vendor pricing in real time to stay aligned with market changes [23]. These adjustments ensure that your inventory strategy remains agile and responsive to evolving demand.
Conclusion
Recap of Metrics and Methods
Forecasting inventory turnover relies on a few essential metrics that help businesses make smarter decisions. The Inventory Turnover Ratio (calculated as COGS ÷ Average Inventory) shows how often you’re cycling through stock. A healthy range for eCommerce businesses is typically between 4 and 8 [25]. Days Inventory Outstanding (DIO) measures how long products sit in inventory before selling, while Gross Margin Return on Investment (GMROI) evaluates profitability per dollar invested in inventory, with a target value above 2.5 [25]. Keeping an eye on your Stockout Rate is also critical to avoid missed sales opportunities and ensure efficient inventory management.
When it comes to forecasting methods, time-series analysis leverages historical data to identify trends and seasonal patterns [6]. For more precision, AI-powered demand forecasting can improve accuracy by 30% to 40%, allowing for real-time adjustments at the SKU level [25]. Whether you’re calculating reorder points or validating forecasts with metrics like WMAPE, the ultimate goal remains the same: align inventory levels with actual demand while minimizing excess stock and tied-up capital.
"Inventory turnover is more than a simple metric, it's a key lever for managing cash flow, improving operational efficiency, and supporting frictionless growth." - Warren Brown, Head of Product, Settle [24]
Forecasting as a Growth Tool
Armed with these metrics and methods, forecasting becomes a critical driver of growth. Accurate forecasting doesn’t just prevent stockouts - it frees up capital for scaling by ensuring inventory orders are optimized for demand. Tools like Onramp Funds offer revenue-based financing that aligns repayments with sales, making it easier to stock up ahead of peak seasons without overextending cash flow. With global eCommerce sales projected to hit $6.09 trillion in 2024 [25], businesses that excel at forecasting are well-positioned to capture a larger share of the market.
Forecasting isn’t a one-and-done task; it’s an ongoing process. Regularly updating models to reflect seasonality and real-time data ensures your operation remains agile. Adjusting reorder points as needed keeps your inventory strategy in sync with demand. By mastering forecasting, businesses can build scalable, resilient operations that not only optimize inventory but also strengthen their financial strategy. Tools like Onramp Funds make it easier to achieve sustainable growth while navigating the complexities of eCommerce.
FAQs
What’s the best turnover ratio for my product category?
The ideal inventory turnover ratio isn’t a one-size-fits-all number - it depends heavily on the industry and the type of product. In general, a ratio between 5 and 10 per year signals efficient inventory management. For example:
- Fashion: Typically ranges from 6 to 12.
- Electronics: Falls between 4.5 and 8.
- Home goods: Often lands around 2.5 to 5.
That said, these benchmarks can shift. Durable goods usually have lower turnover ratios, while fast-moving products aim for higher numbers. To manage cash flow effectively and meet customer demand, it’s crucial to measure your ratio against your industry’s standards.
How can I forecast demand for a new SKU with limited sales history?
To predict demand for a new SKU with minimal sales history, start by examining how past product launches performed within your business or looking at similar items in your industry. Pair this with insights from market research, current industry trends, and consumer behavior patterns. You can also dig into category trends, analyze competitor product launches, and gather feedback from experts or potential customers. By blending these strategies, you can develop a more reliable demand estimate, even with limited historical data to work with.
How can I factor supplier delays into reorder points and safety stock?
To factor in supplier delays, make sure to include lead time when calculating your reorder point: (Average daily demand × Lead time) + Safety stock. Lead time refers to the total time it takes from placing an order to receiving the stock. Including safety stock acts as a cushion for unexpected demand spikes or potential supplier delays. This method helps maintain consistent inventory levels and reduces the risk of running out of stock by accounting for both demand changes and supplier dependability.
