

TikTok and YouTube are two of the most popular platforms for eCommerce advertising, but they cater to different goals and audiences. Here's the bottom line:
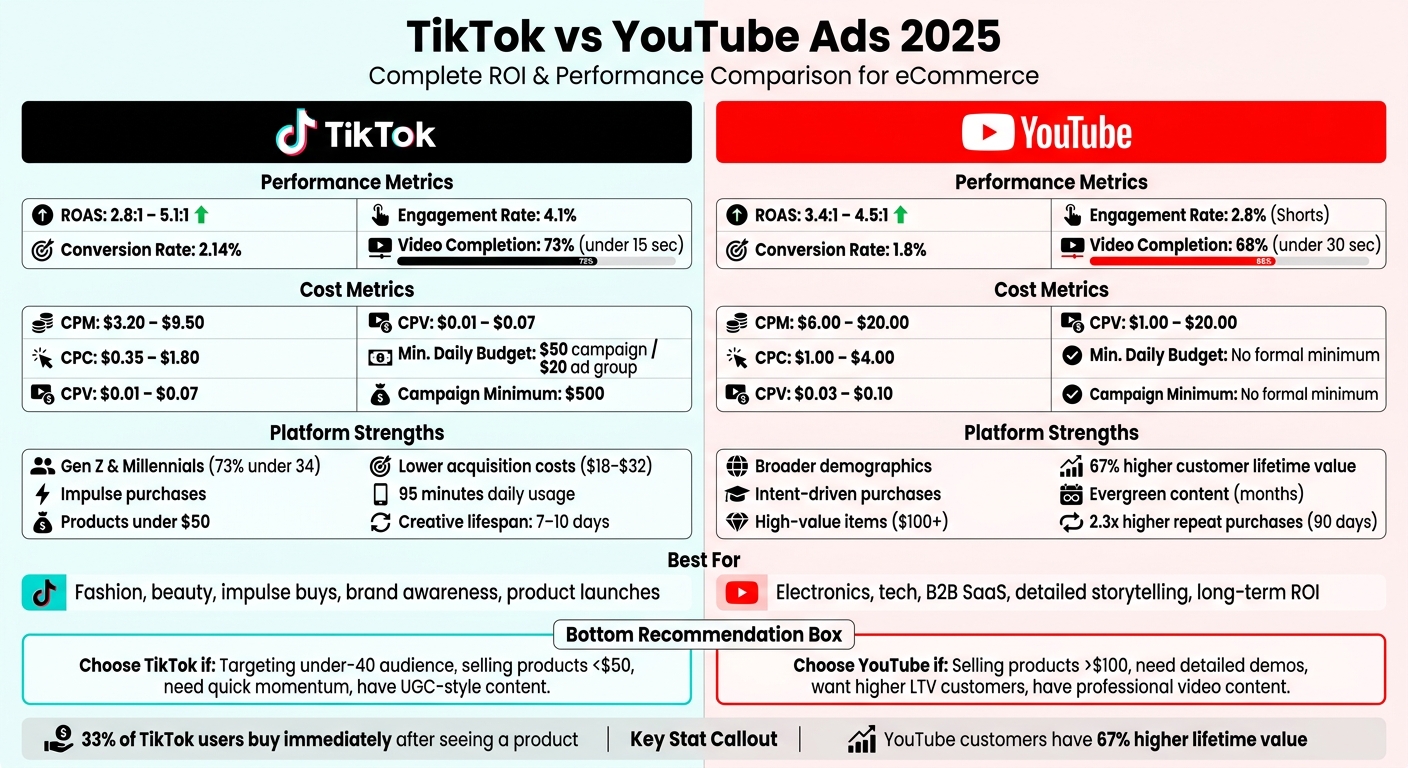
- TikTok delivers stronger results for impulse purchases and lower-priced items (under $50), with average ROAS ranging from 2.8:1 to 5.1:1. Its lower costs (CPC: $0.35–$1.80, CPM: $3.20–$9.50) and high engagement make it ideal for reaching Gen Z and Millennials. However, TikTok ads require frequent updates due to creative fatigue.
- YouTube excels at intent-driven purchases, higher-priced products, and long-term ROI, with ROAS averaging 3.4:1 to 4.5:1. Its evergreen content and advanced targeting options make it a better fit for detailed storytelling and higher-value items. Costs are higher (CPM: $6.00–$20.00, CPV: $0.03–$0.10), but customers have a 67% higher lifetime value compared to TikTok.
Both platforms can drive results, but the choice depends on your product type, target audience, and campaign goals. Below is a quick comparison:
Quick Comparison
| Metric | TikTok (2025) | YouTube (2025) |
|---|---|---|
| ROAS | 2.8:1 – 5.1:1 | 3.4:1 – 4.5:1 |
| CPC | $0.35 – $1.80 | $1.00 – $4.00 |
| CPM | $3.20 – $9.50 | $6.00 – $20.00 |
| Conversion Rate | 2.14% | 1.8% |
| Audience | Gen Z, Millennials | Broader demographics |
| Best For | Impulse buys, <$50 | High-value items, >$100 |
| Creative Lifespan | 7–10 days | Months (evergreen) |
If you're targeting younger audiences with low-cost products, TikTok is the better choice. For higher-ticket items or campaigns needing detailed storytelling, YouTube is the way to go.
TikTok vs YouTube Ads 2025: Cost, Performance & ROI Comparison
Why TikTok Ads Can Beat YouTube Ads on Cost

sbb-itb-d7b5115
TikTok Ads: Platform Overview and Performance Data
By 2025, TikTok has solidified itself as a major eCommerce player, boasting 1.94 billion monthly active users [7]. Its audience is heavily skewed toward Gen Z (41% aged 18–24) and Millennials (32% aged 25–34) [8]. These users spend an average of 95 minutes daily on the platform, making it the leader in engagement time among social media apps [8].
TikTok’s appeal lies in its short-form videos and focus on authenticity. Ads that feel like organic content - especially user-generated content (UGC) - perform best, seamlessly fitting into the "For You" feed. This style resonates with younger audiences who avoid traditional ads but are drawn to content that feels relatable. Impressively, 33% of TikTok users have purchased a product immediately after seeing it on the platform [7], making it a top choice for impulse buys under $50.
"The mistake many brands make is assuming TikTok is still just for teenagers. The platform has matured, and so has its audience. What makes TikTok ads worth the investment is their ability to reach diverse demographic segments with highly targeted creative." – Eric Siu, CEO, Single Grain [2]
TikTok’s algorithm is another standout feature. It quickly learns user preferences through engagement patterns, delivering highly relevant content and ads faster than other platforms [1]. Ads under 15 seconds perform particularly well, achieving a 73% completion rate [8]. Additionally, creative quality plays a huge role, accounting for over 50% of sales growth on the platform [7]. This highlights the critical importance of strong, engaging ad content.
TikTok Ad Performance Numbers for 2025
TikTok’s 2025 ad metrics demonstrate its effectiveness for eCommerce campaigns. The return on ad spend (ROAS) averages between 2.8:1 and 5.1:1 [7][8], with top-performing campaigns achieving even higher results by rotating creative assets and using TikTok Shop’s seamless integration.
Cost-wise, TikTok is highly competitive. The cost per click (CPC) ranges from $0.35 to $1.80 [3][8], far below Instagram’s $2.50 and Facebook’s $2.85 [8]. Similarly, the cost per thousand impressions (CPM) falls between $3.20 and $9.50 [3][8], making TikTok an affordable choice for reaching large audiences. The platform’s conversion rate averages 2.14% [8], outperforming many other channels.
| Metric | 2025 Performance Range |
|---|---|
| Average ROAS | 2.8:1 – 5.1:1 [7][8] |
| Average CPC | $0.35 – $1.80 [3][8] |
| Average CPM | $3.20 – $9.50 [3][8] |
| Conversion Rate | 2.14% [8] |
| Minimum Daily Budget | $50 per campaign [3] |
A standout example comes from Willow Boutique, which used TikTok Shop video shopping ads alongside organic content in October 2025. Their campaign achieved an 8x ROAS, with 69% of sales directly attributed to TikTok ads and a 65% reduction in cost per acquisition [10]. TikTok Shop’s in-app checkout played a key role, boosting conversion rates by up to 40% by simplifying the buying process [8].
These results highlight TikTok’s potential for creative-driven campaigns.
What TikTok Ads Do Well
TikTok stands out for its ability to produce viral content that can exponentially expand reach. Branded Hashtag Challenges, for example, see an average engagement rate of 8.5% [8], while the platform’s overall engagement rate is about 4.5% [9]. When campaigns resonate, they often spread through shares and duets, amplifying the impact of ad spend.
Lower ad costs make TikTok especially appealing for brands looking to test new products or scale quickly. With CPMs starting at just $3.20, brands can reach thousands of users without overspending. Spark Ads, which boost successful organic content, deliver 40–60% better cost per acquisition and ROAS than traditional ads [3]. These ads are particularly effective for eCommerce brands leveraging creator partnerships.
Another strength lies in TikTok’s native ad integration, which ensures ads blend seamlessly with organic content. For example, a premium DTC skincare brand tested Spark Ads against standard In-Feed placements in 2025. Over six weeks, they saw a 40% drop in CPA and a 55% increase in ROAS by refreshing creative hooks and using Cost Cap bidding [3].
TikTok’s in-app checkout options also support impulse purchases, streamlining the buying process and reducing friction for users.
Where TikTok Ads Fall Short
Despite its advantages, TikTok isn’t without challenges. One key issue is creative fatigue. High-performing ads often lose effectiveness after just 7 to 10 days [2][3][9], requiring brands to refresh their creative assets 3–5 times per week [9]. This constant need for new content can drive up production costs and strain smaller teams.
The platform’s short-form content also limits its ability to convey complex product details or tell longer stories. While ideal for visually appealing or low-consideration items, TikTok’s format may not work as well for technical products or those requiring detailed explanations. Additionally, the reliance on trending formats means strategies that work today could quickly become outdated, requiring marketers to stay on top of evolving trends.
Attribution is another hurdle. Around 30–40% of TikTok conversions are "view-through" rather than click-through [9]. Without advanced attribution tools or post-purchase surveys, brands may underestimate TikTok’s true impact on sales.
YouTube Ads: Platform Overview and Performance Data
As of 2025, YouTube offers a variety of ad formats tailored to every stage of the buyer journey. Whether it's Skippable In-Stream ads for in-depth storytelling, 6-second Bumper ads for quick brand recall, or YouTube Shorts for mobile-first awareness campaigns, the platform provides options to suit different marketing goals [11]. What sets YouTube apart from competitors like TikTok is its ability to create "evergreen" content. Unlike TikTok's focus on short-lived trends, YouTube content continues to deliver ROI through Google Search visibility long after a campaign ends [11]. This sustained presence makes it a powerful tool for long-term returns.
YouTube also boasts a broader audience demographic compared to TikTok, making it especially effective for promoting higher-priced products or purchases requiring more thought [11]. The platform's advanced targeting features - like custom segments, affinity groups, and remarketing lists - help brands connect with specific buyer personas [11]. Additionally, YouTube's dominance on TV screens, which now accounts for 65% of video campaign spending [13], ensures extensive reach across devices and viewing contexts. These strengths are reflected in the platform's impressive performance metrics.
YouTube Ad Performance Numbers for 2025
The performance data for YouTube ads in 2025 highlights its effectiveness for eCommerce campaigns. The platform delivers an average Return on Ad Spend (ROAS) between 3.4:1 and 4.5:1 [11], while the average conversion rate sits at 1.8% [11]. Cost metrics vary based on ad format and targeting:
- Cost per view (CPV) for Skippable In-Stream ads ranges from $0.03 to $0.10, with payment triggered after 30 seconds of viewing [11].
- For conversion-focused campaigns, Cost per click (CPC) falls between $1.00 and $4.00 [11].
- Cost per thousand impressions (CPM) spans $6.00 to $20.00, depending on the ad format and targeting approach [11][12].
One standout advantage is YouTube's ability to reduce Customer Acquisition Cost (CAC) by up to 60% when paired with a strong retargeting strategy [11]. This makes the platform especially appealing for brands with longer sales cycles or higher-value products, where quality conversions outweigh initial costs.
What YouTube Ads Do Well
YouTube's strength lies in its ability to deliver content that remains effective over time. Unlike TikTok ads, which often lose momentum after a week or so, YouTube's "evergreen" content continues to attract views and conversions through search results for months or even years [11][2]. This makes YouTube an ideal platform for educational content, product demos, and tutorials - types of material that resonate with users looking to learn. In-Feed Video ads, which appear directly in search results, are particularly effective for engaging these audiences.
The platform's diverse ad formats, longer video options, and seamless integration with Google enhance storytelling opportunities. These features are essential for building trust and driving conversions, especially for higher-priced or complex products [1][11]. Brands can craft comprehensive funnel strategies by combining 6-second Bumper ads for remarketing with Skippable In-Stream ads and In-Feed ads. Plus, Google Analytics integration adds precision to targeting and performance tracking [11].
Where YouTube Ads Fall Short
One of YouTube's key challenges is the higher production cost associated with creating long-form content. Unlike TikTok's user-generated style, which can be filmed quickly with a smartphone, successful YouTube ads often require professional scripting, filming, and editing [11][2]. While this investment pays off in the long run, it demands careful budget planning upfront.
Additionally, YouTube's CPM rates, ranging from $6.00 to $20.00 [11][12], can stretch budgets, especially for non-skippable ads. During high-demand periods like Q4 or peak shopping seasons, these costs can rise further, making seasonal budgeting essential [11].
While YouTube Shorts is gaining traction, its engagement rates still trail behind TikTok's short-form content [3]. The platform's algorithm and audience preferences lean toward longer videos, making it less effective for capturing the viral energy that TikTok thrives on.
Lastly, YouTube's strength in evergreen content can be a drawback for trend-driven or time-sensitive campaigns. Its slower content discovery process means it’s not the best choice for capitalizing on viral moments or executing flash sales that require immediate attention.
Ad Cost Breakdown: TikTok vs YouTube
When planning eCommerce ad campaigns for 2025, understanding the cost differences between TikTok and YouTube is essential. Both platforms offer great potential for returns, but their pricing models and budget requirements vary significantly. TikTok uses an auction-based system where factors like ad format, audience competition, and creative quality influence costs [3][14]. In contrast, YouTube offers a simpler pricing structure, with a baseline CPM of around $6.00 [12].
TikTok's Budget Requirements
TikTok ads come with specific spending thresholds. Campaigns require a minimum of $500, with daily budgets set at $50 at the campaign level and $20 per ad group to gather meaningful data [10][14][17]. For a proper 30-day test, experts suggest setting aside $1,500 to $3,000 [3][15]. TikTok also rewards content that feels natural and engaging, offering CPM discounts of 35% to 45% for high-performing ads [14][16]. User-generated content (UGC) tends to perform exceptionally well on TikTok, delivering 2.5 times more engagement and a 70% higher ROI compared to polished brand ads [14].
YouTube's Budget Flexibility
On the other hand, YouTube doesn't enforce a formal minimum spend requirement, making it an attractive option for advertisers with tighter budgets [16]. However, the platform often demands a higher upfront investment in creative production, such as professional scripting, filming, and editing, to maximize the performance of its longer-form content.
Cost Comparison Table
Here’s a quick side-by-side breakdown of key metrics:
| Metric | TikTok (2025/2026) | YouTube (2025/2026) |
|---|---|---|
| Average CPM | $4.00–$10.00 [3][15][16] | ~$6.00 [12] |
| Average CPC | $0.17–$1.00 [15][17] | N/A |
| Average CPV | $0.01–$0.07 [10] | $0.03–$0.10 [11] |
| Min. Daily Budget (Campaign) | $50 [3][15] | No formal minimum [16] |
| Min. Daily Budget (Ad Group) | $20 [3][15] | No formal minimum [16] |
| Total Campaign Minimum | $500 [10][14][17] | No formal minimum [16] |
| Creative Production Cost | Low (UGC-style) | High (professional long-form) |
Seasonal Considerations
TikTok CPMs can rise by 30% to 65% during the Q4 holiday shopping season, making it crucial to plan seasonal budgets carefully [14]. Similarly, while YouTube's average CPM is around $6.00 [12], seasonal demand can also lead to price fluctuations.
Tips for Budget Allocation
How you allocate your budget depends on your product, audience, and marketing strategy. For brands targeting Gen Z and Millennials, dedicating about 40% of your ad spend to TikTok and splitting the rest among platforms like Instagram and Facebook can be effective [14]. TikTok works well for top-of-funnel brand awareness, while YouTube excels in mid-funnel strategies like tutorials and product demos [12][14].
Start with TikTok's "Lowest Cost" bidding to gather data, then transition to "Cost Cap" once acquisition costs stabilize. Gradually increase budgets by 20%–30% daily [3][15][16]. If you're struggling to generate 50 purchases a month, try optimizing for "Add to Cart" instead of "Complete Payment" to give TikTok's algorithm more data to work with [16].
For TikTok, committing $1,500 to $3,000 for a 30-day test can yield strong results, thanks to its engagement rates of 5.7% to 7.8% and viral potential [14]. Spark Ads, which amplify organic content, often achieve 40% to 60% better CPA and ROAS compared to standard brand ads [3]. To maintain low CPMs and avoid ad fatigue, refresh TikTok creatives every 7 to 10 days [3][10].
When cash flow is tight, revenue-based financing from Onramp Funds can be a lifeline for eCommerce sellers. This type of funding ties repayments to sales performance, offering flexibility to test and scale campaigns on both platforms without giving up equity.
Engagement and Conversion Rates: Platform Comparison
After examining costs, it's time to dive into how TikTok and YouTube compare when it comes to audience engagement and conversion behavior. These insights are key to shaping an effective ad strategy for 2025 - because getting clicks is one thing, but turning those clicks into actual sales is where the magic happens.
Engagement Rate Comparison
TikTok stands out for its ability to grab and hold user attention. In 2025, the platform boasts a 4.1% engagement rate per post - the highest among social networks [6]. Users spend an average of 95 minutes daily on TikTok, broken into multiple short sessions, making it ideal for quick product discovery [5] [8]. This user behavior also supports strong ad performance, with a 73% video completion rate for ads under 15 seconds [8].
YouTube, on the other hand, thrives on deeper, more focused engagement. While YouTube Shorts ads see a 2.8% engagement rate, the platform excels at longer viewing sessions, averaging 40+ minutes per session [6]. Interestingly, 12.5% of U.S. YouTube watch hours now happen on TV screens, signaling a shift toward more relaxed, immersive viewing [19].
Here’s a quick side-by-side look at their engagement metrics:
| Metric | TikTok (2025/2026) | YouTube (2025/2026) |
|---|---|---|
| Avg. Engagement Rate | 4.1% [6] | 2.8% (Shorts) [8] |
| Video Completion Rate | 73% (under 15 sec) [8] | 68% (under 30 sec) [8] |
| Daily Time Spent | 95 minutes [5] [8] | 40+ minutes per session [6] |
| Creative Lifespan | 7–10 days [2] | Months (evergreen content) [6] |
| Session Type | 10+ micro-sessions daily [19] | Longer, focused sessions [19] |
YouTube’s strength lies in its ability to keep ads relevant for months, especially when brands use storytelling or educational content. While these numbers highlight each platform's strengths, the real test lies in their ability to turn engagement into conversions.
Conversion Performance for eCommerce
Engagement is important, but for eCommerce, conversions are the ultimate goal. TikTok leads the pack with an average conversion rate of 2.14%, making it the top-performing social platform for driving purchases. Campaign-specific rates range from 1.1% to 2.4%, and for certain categories - like beauty products priced between $15 and $35 - TikTok Shop can hit conversion rates as high as 8.2% [8] [18]. TikTok’s strength lies in its ability to trigger impulse buys, with many conversions happening within just two hours of the first ad exposure [4].
"TikTok finds users who did not know they wanted your product. YouTube catches users who are already thinking about a topic related to your product."
– MHI Growth Engine [6]
YouTube, however, takes a different path to conversions. While immediate conversion rates may not match TikTok’s, YouTube attracts users who are actively researching solutions. This often leads to higher customer lifetime value. For example, customers acquired through YouTube are 2.3x more likely to make repeat purchases within 90 days compared to TikTok Shop customers [4].
A real-world example from October 2025 highlights these differences. A skincare brand with an average order value of $45 tested TikTok Shop against Amazon Ads (which mirrors YouTube's audience intent). The TikTok campaign generated 2,847 orders, $104,919 in revenue, and a 2.1x ROAS in the first month. However, repeat purchases were just 11%. In contrast, the Amazon campaign delivered fewer orders - 1,653 - and $89,201 in revenue, but the repeat purchase rate hit 44% by the second month [4].
Price point matters. TikTok excels with products under $80, such as fashion and beauty items, while YouTube is better suited for higher-ticket items over $100 that require more explanation or demonstration [6]. TikTok Shop’s in-app checkout feature boosts conversion rates by up to 40% compared to external links [8]. Meanwhile, YouTube creates a "halo effect", increasing branded search volume on Google, where many conversions ultimately happen [6].
Both platforms, however, face challenges with tracking conversions. Last-click attribution often underreports conversions by 25% to 50%, especially for TikTok, as many purchases are completed later via Google Search. To get a clearer picture, brands should rely on post-purchase surveys to measure campaign impact accurately.
ROI Comparison for eCommerce Businesses
ROI data highlights how each platform brings distinct advantages depending on factors like product category, pricing, and business objectives. While both TikTok and YouTube can drive profitability, their strengths shine in different scenarios.
ROAS Comparison by Campaign Type
TikTok and YouTube deliver varying returns based on campaign goals and creative execution. In 2025, TikTok achieved an average ROAS of 5.1:1, slightly surpassing YouTube's 4.5:1 [8]. However, performance shifts significantly depending on the type of campaign:
| Campaign Type | TikTok Performance | YouTube Performance |
|---|---|---|
| Brand Awareness | 2.1% CTR (In-Feed) [8] | 3.1% View Rate (Bumper Ads) [8] |
| Direct Sales / Conversion | 5.1:1 ROAS [8] | 4.5:1 ROAS [8] |
| High-Impact / Launch | 6.8% CTR (TopView) [8] | 2.8% Engagement (Shorts) [8] |
| UGC / Authentic | 3.2% CTR (Spark Ads) [8] | 1.6% CTR (TrueView) [8] |
TikTok Shop demonstrated strong performance in Q4 2025, averaging a 3.2x ROAS, with customer acquisition costs ranging from $18 to $32. Creator-driven Spark Ads outperformed standard ads, delivering 40%–60% higher ROAS [4] [3]. For example, a premium skincare brand cut its CPA by 40% and boosted ROAS by 55% in just six weeks by switching to Spark Ads paired with Cost Cap bidding [3].
While TikTok provides impressive upfront returns and lower acquisition costs, YouTube stands out for delivering customers with a 67% higher lifetime value over a 12-month period [4].
Next, let’s explore how ROI varies by product category to help refine platform strategy.
ROI by eCommerce Category
Expanding on campaign comparisons, product categories see distinct outcomes on TikTok and YouTube. Fashion and beauty products thrive on TikTok, where visually engaging content drives impulse buys for items under $50 [4]. On the other hand, electronics and tech products perform better on YouTube, as consumers often research and seek detailed explanations before purchasing higher-priced items [4].
Home and lifestyle products succeed on both platforms but for different reasons: TikTok showcases their aesthetic appeal and quick-use cases, while YouTube excels in delivering in-depth how-to content and transformation videos. In the B2B SaaS sector, YouTube far outpaces TikTok, achieving a 6.8:1 ROAS for software solutions, while TikTok struggles with just a 1.3% conversion rate [8].
"TikTok Shop is your momentum engine. Amazon Ads [or YouTube] is your growth foundation." – Synergist Digital Media [4]
Scaling ad campaigns effectively on either platform requires the ability to test and refine strategies. Onramp Funds offers revenue-based financing tailored to eCommerce businesses on platforms like TikTok Shop, Shopify, and Amazon. With funding available within 24 hours and repayment tied to your sales, you can confidently invest in high-performing campaigns without stretching your cash flow. Whether launching on TikTok or scaling on YouTube, having flexible financing ensures you’re ready to seize ROI opportunities as they arise.
Platform Selection Guide and Next Steps
How to Choose the Right Platform
The platform you choose can make or break your eCommerce results in 2025. It all depends on aligning your goals with your audience. For example, TikTok is perfect for visually appealing products under $50 that spark impulse buys. If your target audience is under 40 and you're aiming for quick sales, TikTok's customer acquisition costs (ranging from $18–$32) make it an excellent choice to build momentum[4]. On the other hand, YouTube is better suited for products that require more consideration - think electronics, tech gadgets, or B2B solutions. YouTube users also tend to have a higher lifetime value, with customers delivering 67% more value over a 12-month period[4].
"TikTok Shop is your momentum engine. Amazon Ads [Intent-based ads] is your growth foundation. Trying to make one platform do both jobs is how you end up with mediocre results." – Synergist Digital Media[4]
Your creative output matters just as much as your budget. TikTok thrives on fresh, native-style content, which needs to be updated every 7–10 days to maintain performance. If that pace feels overwhelming, YouTube offers a more forgiving creative cycle with longer-lasting content[2][3]. A good starting point is a 30-day test with a budget of $1,500–$3,000 to allow the platform's algorithm to optimize[3]. Pay special attention to your creative "hooks", as the first three seconds of your content can account for over 50% of the sales impact[7].
Funding Your Ad Campaigns
Scaling your campaigns often requires extra funding, and you can't afford to disrupt your cash flow in the process. Onramp Funds is a great solution for eCommerce brands. They offer revenue-based financing tailored for platforms like TikTok Shop, Shopify, Amazon, and YouTube. You can access funds in as little as 24 hours, with repayments tied directly to your sales performance. This allows you to test new platforms, update creative assets, and scale successful campaigns without worrying about cash flow issues.
What makes this financing model stand out is its flexibility. Payments adjust based on your revenue - if sales slow down, your payments decrease too. This approach is especially helpful when balancing TikTok's fast returns with YouTube's longer-term benefits. Combining these funding options with clear platform strategies can help you grow confidently.
Key Takeaways
With the right platform strategy and financing options, you can create a game plan tailored to your business. TikTok offers lower entry costs, with CPMs around $4–$7, compared to YouTube's CPMs of $8–$12. TikTok also delivers higher engagement rates and quicker results, making it ideal for brand awareness, product launches, and clearing inventory[2][3]. Meanwhile, YouTube shines in long-term ROI, thanks to higher customer lifetime value and repeat purchase rates that can be up to 2.3x higher within 90 days[4].
Ultimately, there’s no one-size-fits-all answer. Your product type, audience, and goals should guide your choice. To make the most of your efforts, calculate your breakeven ROAS using the formula 1 / Profit Margin[7], allocate a proper testing budget, and explore financing options like Onramp Funds. This approach ensures you can align your budget, platform strengths, and financing strategies to achieve maximum ROI.
FAQs
How do I calculate my breakeven ROAS?
To figure out your breakeven ROAS (Return on Ad Spend), take 1 and divide it by your profit margin (written as a decimal). For instance, if your profit margin is 25% (or 0.25), your breakeven ROAS would be 4. This means you need to generate $4 in revenue for every $1 spent on ads. Hitting this number ensures your ad costs are covered, keeping you from running at a loss.
How should I split my budget between TikTok and YouTube?
Allocating your budget effectively means understanding your goals and audience. TikTok is a powerhouse for reaching Gen Z and Millennials, thriving on trend-focused content. In 2025, TikTok's average CPM sits at $10, with a median ROAS of 1.4×. On the other hand, YouTube, with its $6 CPM, shines for longer-form content like product demos, offering the opportunity for deeper engagement. A smart approach is to split your budget strategically - dedicating around 30-40% to TikTok and the rest to YouTube often yields the best ROI.
How can I track TikTok view-through conversions more accurately?
To get better results with TikTok view-through conversion tracking, start by integrating the TikTok Pixel into your website. This tool lets you track what users do after they view or click on your ads, giving you valuable insights into their behavior.
Make sure to refresh your ad creatives every 3–7 days. This prevents ad fatigue and keeps your campaigns engaging while ensuring your data stays accurate.
Keep an eye on important metrics like ROAS (Return on Ad Spend), CPA (Cost Per Acquisition), and CTR (Click-Through Rate). These numbers help you measure how well your ads are performing and where adjustments might be needed.
By combining these strategies, you can fine-tune your view-through conversion tracking and boost your overall ad performance.
