
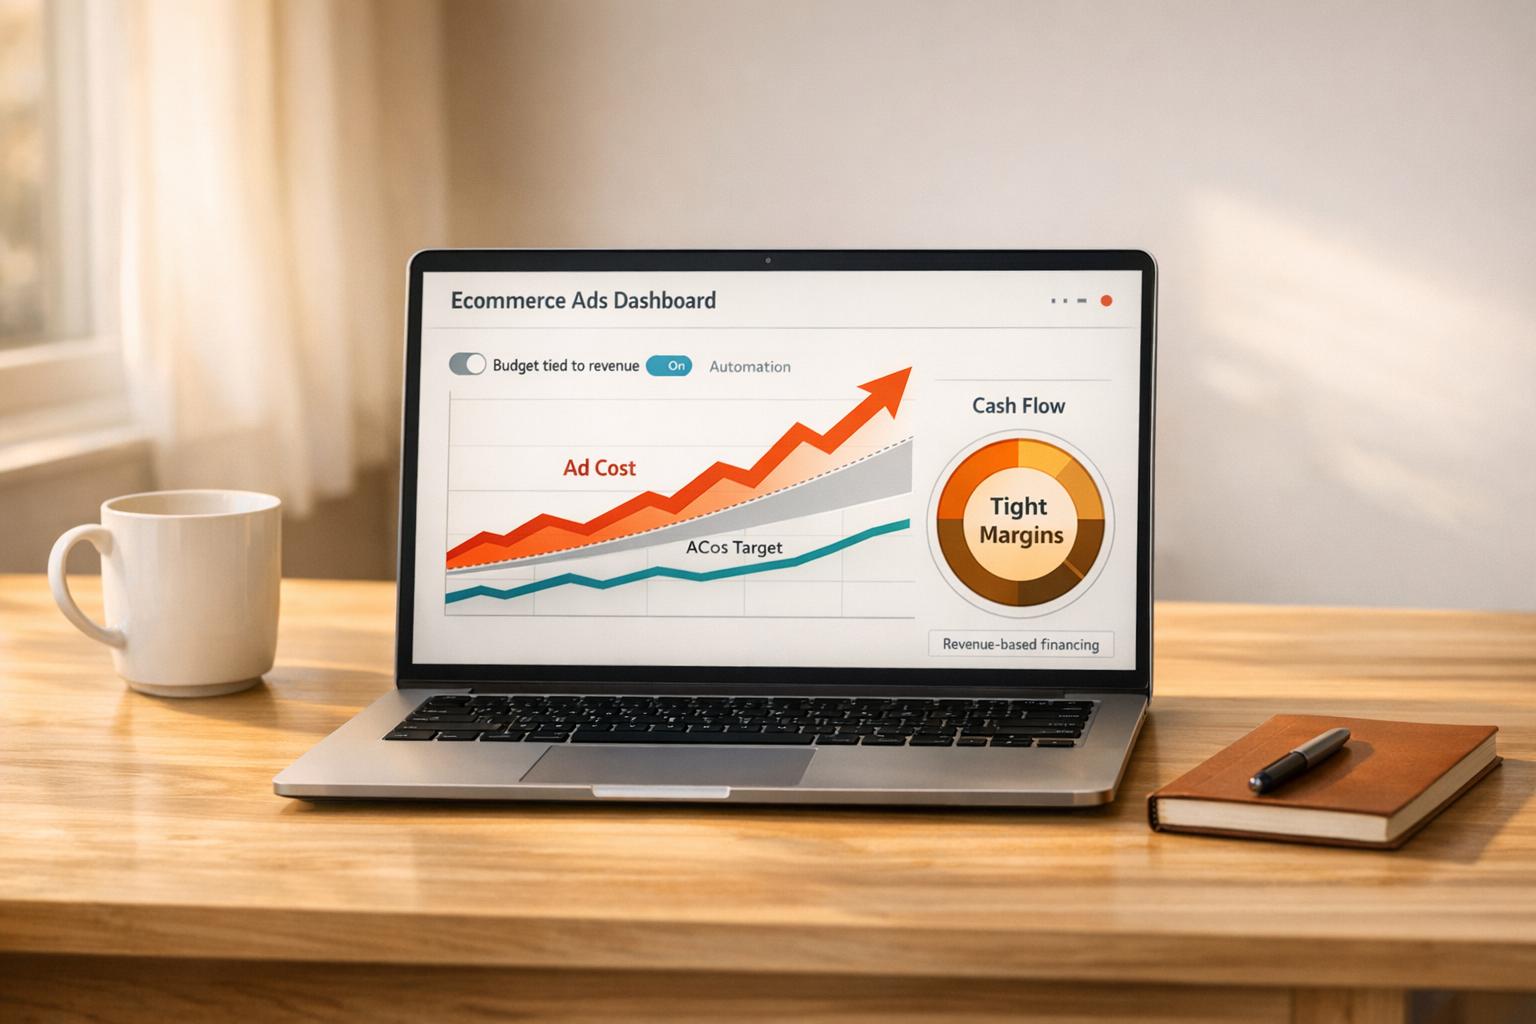
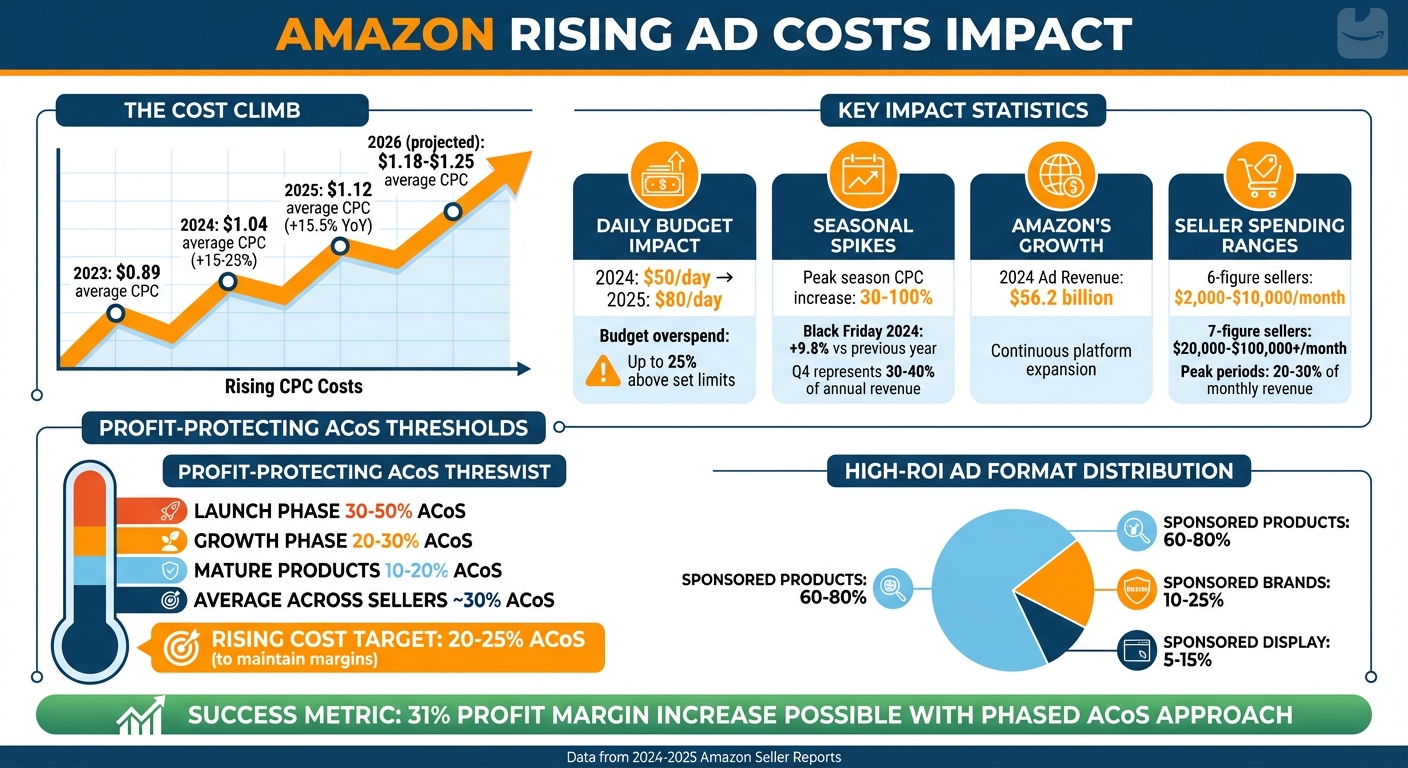
Rising ad costs on Amazon are squeezing sellers' cash flow. In 2025, the average cost-per-click (CPC) increased to $1.04, up 15–25% from 2023. Amazon’s advertising revenue soared to $56.2 billion in 2024, fueled by growing competition among sellers and non-endemic advertisers. These trends are forcing sellers to spend more just to maintain sales, often leading to cash flow challenges, especially during high-demand periods like Prime Day or Black Friday when CPCs can spike by 30%.
Key takeaways:
- Higher CPCs: Sellers are spending more on ads, with daily budgets often exceeding set limits by up to 25%.
- Seasonal spikes: Ad costs double or triple during peak periods, straining budgets further.
- Profit margins at risk: Without a rise in conversion rates, sellers face higher Advertising Cost of Sales (ACoS), cutting into profits.
- Cash flow pressure: Sellers must balance ad spend, inventory costs, and seasonal demands.
To navigate these challenges:
- Set ad budgets as a percentage of revenue (e.g., 5–15%).
- Focus on high-performing ad formats like Sponsored Products.
- Use negative keywords to cut wasted spend.
- Automate bid adjustments and monitor ACoS closely.
- Consider revenue-based financing to bridge cash flow gaps.
These strategies can help sellers manage rising costs while protecting profitability.
Amazon Ad Cost Increases and Cash Flow Impact 2023-2026
How Rising Amazon Ad Costs Affect Cash Flow

Direct Impact on Operating Capital
As Amazon's cost-per-click (CPC) rates climb, sellers are forced to allocate more cash just to maintain their sales. For example, a seller spending $50 per day on ads in 2024 might need over $80 daily in 2025, even if their conversion rates stay flat [7]. This extra expense ties up working capital that could otherwise go toward purchasing inventory or developing new products [2][7].
Amazon's ad budget rules add another layer of complexity. The platform allows up to 25% overspending above your daily budget when it detects "high-value" shoppers [3]. This means a $100 daily budget could result in $125 being spent, potentially exhausting funds by mid-morning [4].
The impact of these rising costs goes beyond just cash flow. Pausing campaigns due to budget constraints can harm a product’s organic ranking. Steven Pope, Founder of My Amazon Guy, explains, "If your campaigns are paused due to depleting or disabled budget, sales can drop sharply... leading to a sharp decline in both sales and organic ranking" [6]. Regaining those rankings often requires a surge in ad spending, creating what many describe as a "vicious cycle." Sellers may even face tough choices between funding ads or replenishing inventory, risking stockouts that further hurt their rankings [6].
These challenges are only magnified during peak sales periods.
Seasonal Spending and Budget Pressure
Seasonal spikes add even more strain to already stressed budgets. For many Amazon sellers, Q4 accounts for 30–40% of their annual revenue [9], but it also comes with the highest ad costs. CPCs during peak seasons, like Black Friday, can double or even triple as brands compete for prime ad placements [9]. In 2024, CPCs during Black Friday weekend rose by 9.8% compared to the previous year [2].
Amazon’s algorithms can complicate things further by burning through daily budgets early in the day during high-activity auction periods [3]. This can leave brands invisible during prime shopping hours later in the day, especially when cash reserves are already stretched thin by inventory costs and other operational expenses.
Profitability during these seasonal events isn't guaranteed, even with a strong Return on Ad Spend (ROAS). If your gross margin is low, a high ROAS might still result in a loss. Sellers need to calculate their "break-even ROAS" using the formula 1 ÷ Gross Profit Margin to ensure they’re not losing money on every sale [8]. Without this calculation, it’s easy to run campaigns that increase revenue but erode profits.
The Risk of Overspending Without Returns
Beyond the immediate cash flow and seasonal challenges, overspending on ads that don’t convert can become a serious long-term problem. Poorly performing ads can trap funds, especially when a few high-volume keywords - often called "budget vampires" - consume most of the budget without delivering sales [4]. This kind of inefficiency is one of the key reasons why 90% of eCommerce businesses fail [10]. When capital gets tied up in low-margin or non-converting campaigns, sellers lose the ability to reinvest in products that actually drive growth [11].
Amazon’s algorithm also penalizes poorly performing ads, even if they come with high bids [1]. This creates a dangerous dependency on paid traffic while limiting opportunities to build organic sales, ultimately reducing long-term profit margins [5].
"The real optimization opportunity often lies in identifying the losers - the terms that generate clicks but no sales. These are your budget vampires. Starve them." - Headlinema [5]
A good example of tackling this issue comes from Else Nutrition. In January 2026, the brand allocated 30% of its ad budget to target in-market shoppers, recent searchers, and remarketing audiences. This strategic approach helped them maintain an Advertising Cost of Sales (ACoS) under 12% while still expanding their visibility [4]. The takeaway? Without careful targeting and strict budget controls, rising ad costs can drain your cash flow faster than sales can replenish it.
Increase Amazon PPC Cash Flow! How to ask Amazon for payment terms delay your payments for ads
Budgeting Strategies for Rising Ad Costs
As ad costs climb and put pressure on cash flow, taking a disciplined approach to budgeting becomes more important than ever.
Set a Fixed Percentage of Revenue for Ads
One effective way to manage your ad budget is by tying it directly to your revenue. For example, many 6- and 7-figure sellers allocate 5% to 15% of their total revenue to Amazon advertising [13]. This strategy ensures your spending stays proportional to your earnings, helping you avoid overspending during slower sales periods.
You can also adjust your ad spend based on where your product is in its lifecycle. During the launch phase, aim for an ACoS of 30–50%. In the growth phase, target 20–30%, and for mature products, keep it between 10–20%. This phased approach has been shown to increase profit margins by up to 31% [15].
To give you an idea of spending levels, 6-figure sellers typically invest $2,000–$10,000 per month in ads, while 7-figure sellers spend between $20,000 and $100,000+ [13]. However, during high-demand periods like Prime Day or Q4, ad spend can jump to 20% to 30% of monthly revenue as competition heats up [13].
Once your budget is set, the next step is to focus on the ad formats that deliver the best returns.
Focus on High-ROI Ad Formats
With a fixed budget in place, you’ll want to prioritize ad formats that consistently deliver strong returns. Among Amazon’s ad options, Sponsored Products stand out as the most effective for driving sales and achieving high ROAS (Return on Ad Spend) [19]. High-revenue sellers typically allocate 60–80% of their ad budgets to Sponsored Products, 10–25% to Sponsored Brands, and 5–15% to Sponsored Display [13][19].
Before scaling any campaign, it’s crucial to calculate the actual profitability of each SKU. This means accounting for your COGS, Amazon fees, storage costs, and current ad spend [17]. Direct your budget toward your hero ASINs - your top-performing products with optimized listings and ratings of 3.5 stars or higher. These listings have the greatest potential for conversions, and well-optimized listings can boost conversion rates by up to 50%, cutting down on wasted ad spend [18][21].
Establish ACoS Thresholds
To protect your profit margins, establish clear ACoS (Advertising Cost of Sales) thresholds. Your break-even ACoS equals your pre-advertising profit margin, which is critical to understand [14][15]. For instance, if your product’s gross profit margin (after accounting for COGS, Amazon fees, and shipping) is 33%, then a 33% ACoS means you’re breaking even. Anything higher, and you’re losing money on ad-driven sales [16].
To stay profitable, set your target ACoS 5 to 10 percentage points below your break-even point [21]. For example, if your break-even ACoS is 33%, a target of 23% allows for a 10% profit after ads [15]. While the average ACoS for Amazon sellers is around 30% [14], rising CPCs - up 22% year-over-year from $0.89 in 2024 to $1.09 in 2025 - have pushed many sellers to aim for 20–25% ACoS to maintain their profit margins [7].
A real-world example highlights the impact of strict ACoS management. In early 2025, a supplement brand working with PPC Farm turned around a 42% ACoS by implementing precise thresholds and bid adjustments. They redirected 80% of their budget from broad to exact and phrase match, used dayparting with 35% bid boosts during peak hours (7–9 PM), and paused underperforming keywords with ROAS below 2.5x after 15 clicks. Within 90 days, they cut their ACoS to 18% while increasing daily sales from $285 to $912 - all while reducing total ad spend [7].
How to Optimize Ad Spend and Improve ROI
Once you've set your budget, the next step is making every dollar work harder. Fine-tuning your ad spend is essential to maintaining cash flow while driving consistent growth.
Refine Keywords and Use Negative Targeting
Did you know that 20%–30% of ad budgets on Amazon typically go to clicks that don’t convert? [24] The solution lies in your search term reports. Run these reports every Wednesday after a 72-hour stabilization period to identify search queries with high clicks but no sales [24][25]. For terms that consistently fail to convert, add them as negative keywords to stop wasting ad spend [24].
Focus your efforts on high-intent keywords - phrases that show buyers are ready to purchase. For example, words like "buy", "deal", or detailed long-tail keywords such as "men's lightweight running shoes for marathon" often perform better and face less competition [22][18]. If you sell premium products, block terms like "cheap" or "budget" to avoid mismatched traffic [22][23]. Using phrase match negatives can even help eliminate entire categories of irrelevant searches, cutting wasted spend by 15%–30% [23].
For a more detailed approach, try an Ngram analysis to identify recurring patterns in search terms that attract clicks but no sales [24][25]. Also, consider separating branded and non-branded keywords into different campaigns. This strategy lets you allocate budgets more effectively and measure which campaigns drive new customer acquisition [22][27].
Automate Bid Adjustments
Manually adjusting bids is time-consuming and inefficient. Automation can handle this for you, tweaking bids in real time based on factors like conversion likelihood, market trends, and past performance [29]. Set up rule-based guardrails - for example, "lower bid if ACoS exceeds 30%" - to keep your spending under control without constant manual oversight [28][29].
"My favorite aspect of managing Amazon Ads with Optmyzr is how easy it is to manage manual bidding compared to how tedious it is to do it directly on Amazon Ads." - Inés Martín, Head of Performance, Línea Gráfica [26]
Use automation tools to optimize for dayparting (adjusting bids based on time of day) and inventory-aware bidding to avoid overspending during stock shortages [28][29]. Start new campaigns with Amazon's "Dynamic Bidding – Down Only" to gather data while protecting your budget, then switch to "Up & Down" once you see consistent conversion trends [12].
For those running Sponsored Products campaigns consistently for 12 months, data shows an average 11.2% higher ROAS compared to the first month [28]. Weekly optimizations using automation can further boost ad efficiency by 20%–25% within the first quarter [12].
Balance PPC with Organic Sales Strategies
Your ads should do more than just drive immediate sales - they should help you gain organic visibility. When PPC campaigns increase your sales velocity, Amazon's A9 algorithm sees this as a positive signal, which can improve your organic rankings and bring in "free" traffic over time [5][30].
To measure this, calculate your TACoS (total ad cost of sales) by dividing ad spend by total revenue. If your TACoS decreases while revenue grows, it’s a sign that your ads are boosting organic sales. On the other hand, if TACoS increases while sales stay flat, you might be overly reliant on paid traffic [5].
Leverage automatic campaigns to discover high-performing search terms, then shift those terms into manual "exact match" campaigns for tighter control and reduced waste [22]. Weekly reviews of search term reports are key to cutting out inefficient keywords [22]. Finally, audit your unit economics every six months to ensure your breakeven ACoS hasn’t been affected by rising fees or costs [11].
| Ad Type | Average CPC Range | Strategic Objective |
|---|---|---|
| Sponsored Products | $0.75–$1.50 | Direct response and immediate sales |
| Sponsored Brands | $0.90–$2.00 | Brand visibility and top-of-funnel reach |
| Sponsored Display | $0.60–$1.20 | Re-engaging shoppers and brand awareness |
When combined with disciplined budgeting, these strategies can drive immediate sales while building a foundation for long-term growth.
sbb-itb-d7b5115
Using Revenue-Based Financing to Bridge Cash Flow Gaps
When rising ad costs drain your operating capital faster than sales can replenish it, revenue-based financing (RBF) offers a way to keep your campaigns running without the burden of fixed debt repayments. This model adjusts repayments based on your revenue, so you pay more during strong sales periods and less when things slow down. For Amazon sellers, this flexibility can be a game-changer, allowing you to manage cash flow while continuing to invest in ad spend strategically.
How Revenue-Based Financing Works
With RBF, you receive upfront funding in exchange for a small percentage of your future sales. For instance, Onramp Funds evaluates 3–6 months of your Amazon Seller Central data to approve funding, often within 24–48 hours. There's no need for personal credit checks or collateral. Once approved, a percentage - typically 2–8% - is automatically deducted from your daily revenue.
Here’s an example: If your weekly sales total $10,000 and the repayment rate is 5%, $500 would go toward repayment. This setup ensures that repayments adjust to your sales performance, helping you manage cash flow effectively, especially during high-ad-spend periods like Q4 or when testing new ad formats with higher costs.
The cost structure is straightforward: a flat fee of 2–8% on the funded amount, with no hidden charges or compounding interest. For example, if you borrow $20,000 at a 6% fee, your total repayment would be $21,200. The timeline for repayment depends entirely on your sales velocity, adding another layer of flexibility.
Benefits of Onramp Funds for eCommerce Sellers
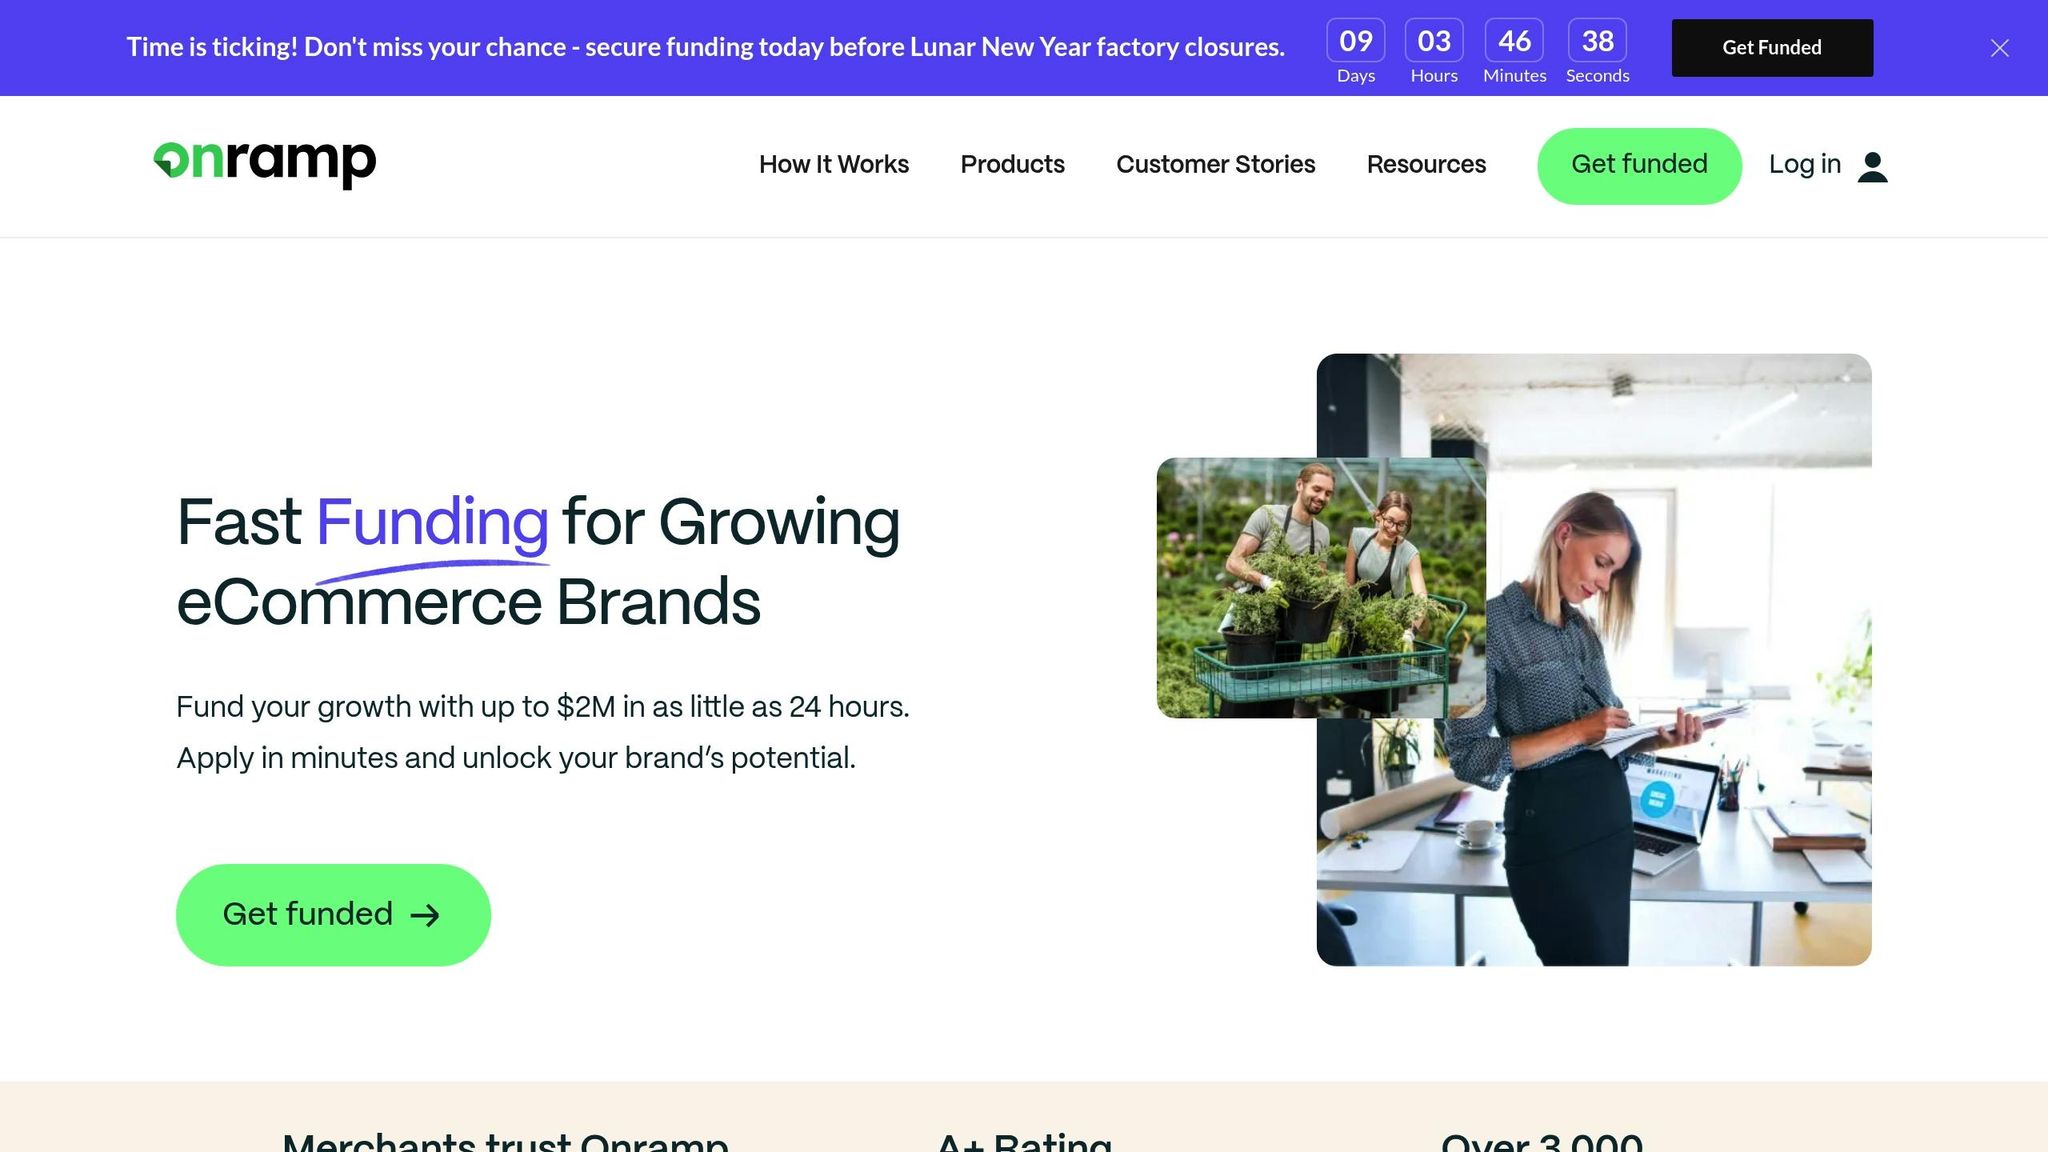
Onramp Funds is tailored to meet the needs of eCommerce sellers grappling with cash flow pressures due to rising ad costs. The platform offers funding amounts ranging from $10,000 to $5 million, all without requiring you to give up equity. Instead of relying on personal credit history, approval is based on your sales performance, making it accessible even when traditional lenders might hesitate.
"Revenue-based financing (RBF) gives sellers upfront capital and collects repayment as a fixed percentage of daily sales. It's dynamic, scalable, and adjusts with performance." - Onramp Funds [31]
One of the standout features is the dynamic repayment structure, which automatically scales down during slower sales periods. For example, if you're running Sponsored Brands campaigns with CPCs between $1.10 and $2.50 and sales take time to ramp up, your repayments will adjust accordingly. On top of that, Onramp Funds provides personalized support, including ad spend audits and tailored budget planning advice from their Austin-based team.
Use the Onramp Funds Calculator for Budget Planning
Before diving into financing, you can use Onramp’s free funding calculator to see how the funding might impact your cash flow. By entering details like monthly revenue, funding amount, and projected growth, the calculator provides estimates for fees, repayment timelines, and daily payment amounts. It also simplifies complex fee structures into a single APR metric and categorizes terms into risk zones: Green for APRs under 20%, Yellow for 21–49%, and Red for anything above 50%.
For example, if you generate $50,000 in monthly sales and request $20,000 in funding, the calculator might show a 6% fee repaid over nine months, with monthly repayments of around $2,333 during peak sales periods. During slower weeks, repayment amounts would decrease. This level of transparency helps you plan for major events like Prime Day or Black Friday, ensuring financing costs stay manageable even as CPCs rise to $1.18–$1.25 by 2026 [32].
Tools for Tracking Amazon Ad ROI
As CPCs climb and budgets tighten, keeping a close eye on ad performance is more important than ever. The right tracking tools can reveal which campaigns are eating into your budget and which ones are delivering results. Amazon Seller Central offers built-in dashboards that provide instant access to your campaign data. The Campaign Manager gives a clear overview of all your ad campaigns, showing total spend, total sales, and performance metrics at a glance [20]. Dive deeper with the Search Term Report to see which search terms are driving conversions, or use the Targeting Report to measure how specific keywords impact ROI [20]. These dashboards allow you to monitor your metrics in real time.
Amazon Seller Central Dashboards
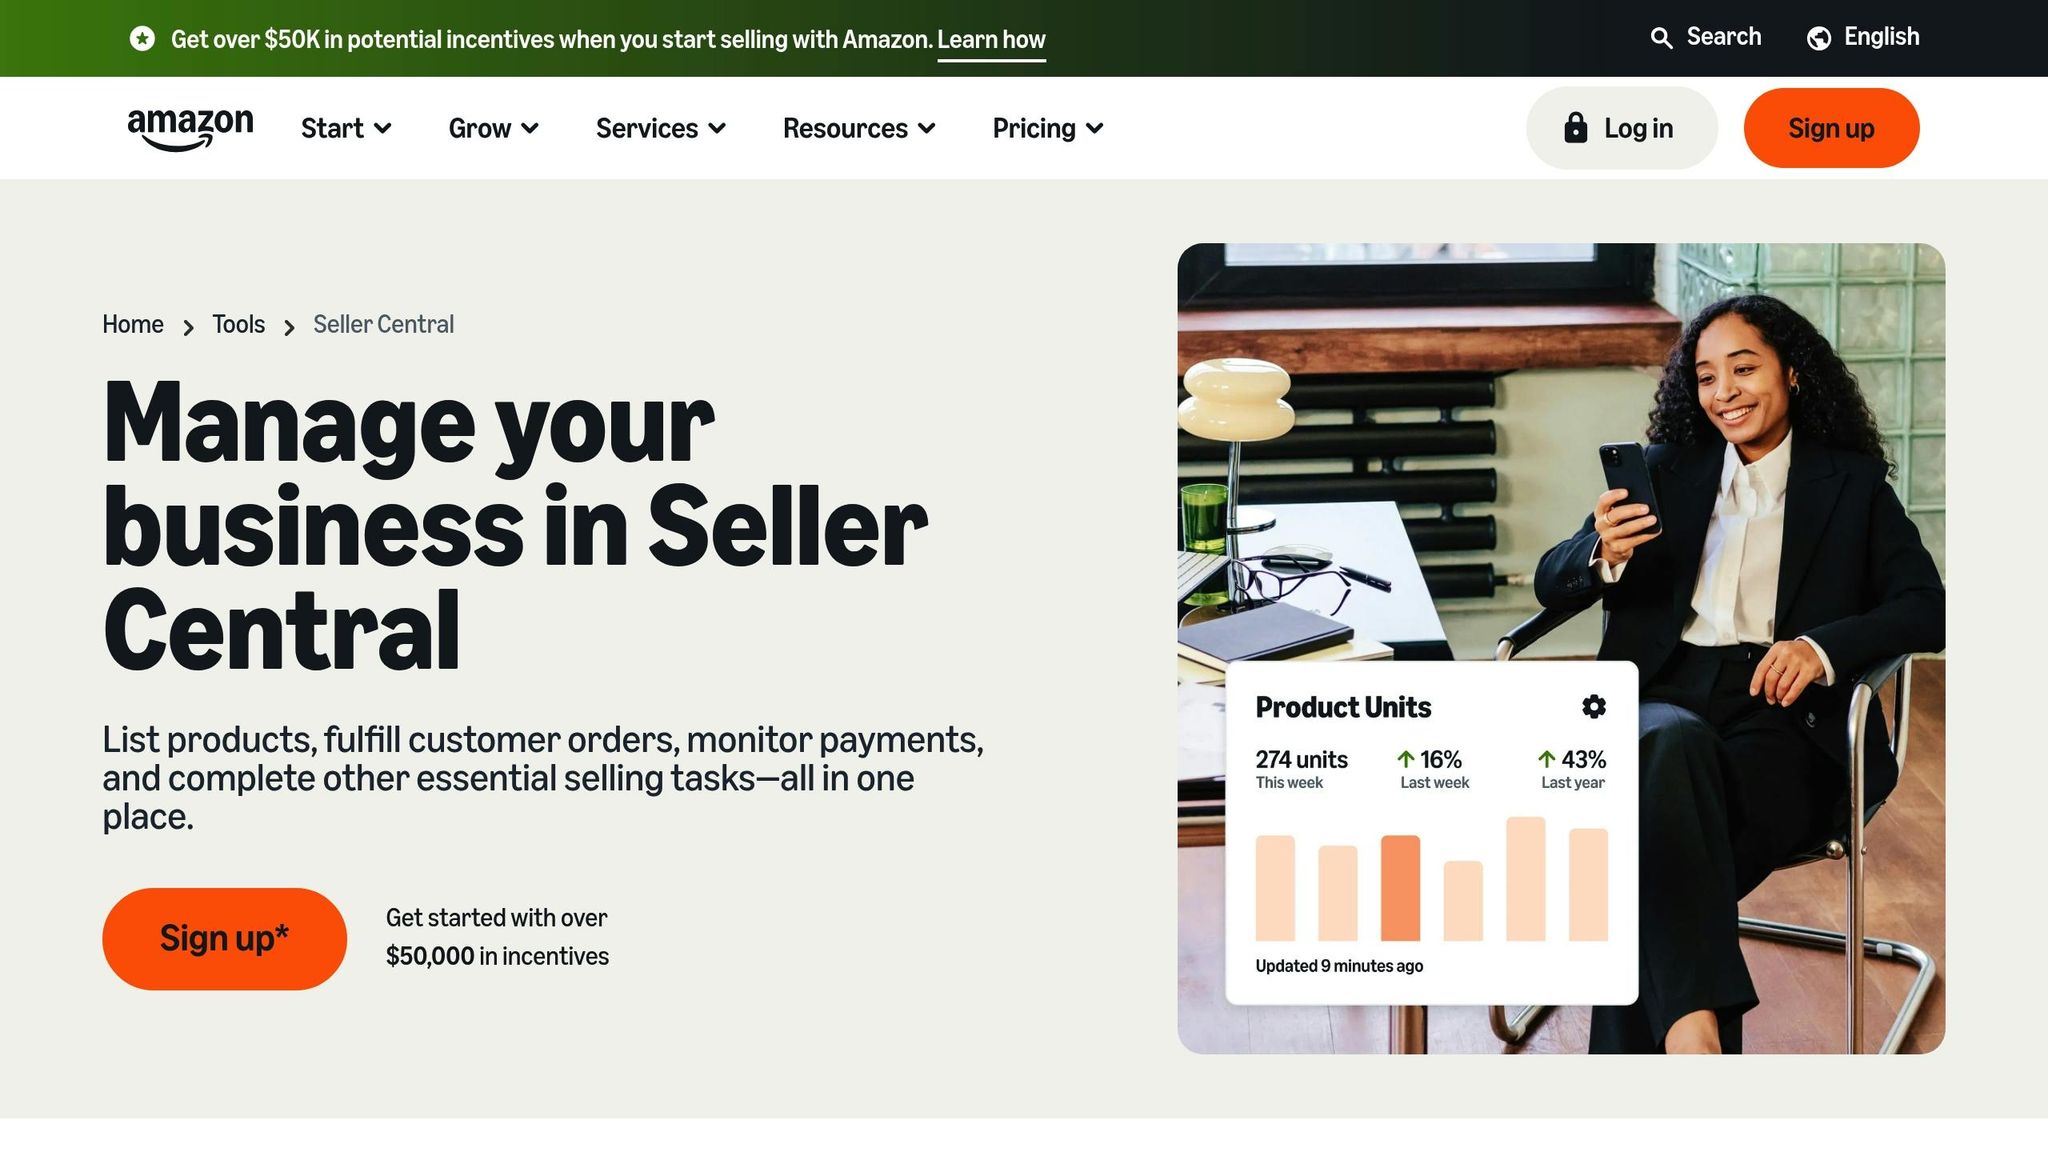
With ad costs rising, tracking ROI effectively is essential for maintaining profitability. Amazon Seller Central provides several tools to help you monitor performance. The Placement Report breaks down how different ad placements - like top-of-search versus product pages - are performing, letting you adjust bids as needed [20]. For brands, the Brand Store Insights Dashboard offers a closer look at how customers interact with your store, giving you a better understanding of customer engagement [20].
One thing to keep in mind: initial impression and click data are usually available within 12 hours, but Amazon advises waiting at least five days to evaluate campaign performance. This delay allows their invalid traffic detection systems to finalize the data [33]. Conversion data can also update for up to 60 days as Amazon refreshes and validates metrics [33].
Calculate ROI with TAC and ACoS Formulas
To measure your campaign efficiency, calculate ACoS (Advertising Cost of Sales) and TACoS (Total Advertising Cost of Sales). ACoS is calculated by dividing ad spend by ad-attributed revenue and multiplying by 100. For example, if you spend $500 on ads and generate $2,000 in ad-attributed sales, your ACoS is 25%. TACoS, on the other hand, compares ad spend to total revenue, including both organic and paid sales.
Profit-driven campaigns typically aim for an ACoS between 10% and 25%, while growth-focused campaigns might see ACoS climb to 40% or higher [34]. The break-even ACoS is where your ad spend equals your product's profit margin - staying below this ensures profitability [35][36].
"ACoS directly reflects profitability. Lower ACoS means more efficient ad spend and higher margins." - beBOLD Digital [34]
Third-Party Analytics Tools
If you want deeper insights, third-party tools can go beyond what Seller Central provides. These platforms calculate true profitability by factoring in costs like COGS, Amazon referral fees, storage, and shipping - not just ad-attributed sales [37][17]. Some tools offer intraday analytics, enabling real-time bid adjustments to avoid wasting your budget [38][17].
For example, in Q1 2023, the brand Naturediet partnered with Acorn-i to implement intraday optimizations using rapid retail analytics. This approach led to a 27% increase in ROAS and reduced campaign optimization time by 90% [38]. Similarly, Zoom Corp, a consumer electronics brand, used DemandHelm to analyze hourly advertising trends. The result? A 145% boost in sales, a 12% improvement in conversion rates, and a 7% increase in ROAS [38].
Many of these tools also feature AI-powered automation for tasks like bid adjustments, keyword harvesting, and negative keyword targeting. This automation helps you maintain ROI without the need for constant manual monitoring [37][17].
Conclusion
Amazon ad costs are on the rise. In 2025, the average cost-per-click (CPC) reached $1.12, marking a 15.5% increase year-over-year. By 2026, projections estimate CPC will climb further, landing between $1.18 and $1.25 [40]. For eCommerce sellers, this trend underscores the need for careful budgeting, strategic ad optimization, and smart financing to maintain profitability and protect cash flow. Many successful sellers tie a portion of their revenue to ad spend, but they also prioritize tactics like aggressive negative keyword management and dayparting to avoid wasting money on low-intent traffic [13][4].
While fine-tuning ad strategies is essential, ensuring consistent cash flow through flexible financing solutions is just as critical. Revenue-based financing, such as Onramp Funds, offers same-day funding after approval, providing sellers with the capital they need to keep campaigns running during periods of high ad costs. This approach helps maintain operations without draining working capital. Plus, repayments are tied to sales volume, so sellers aren't stuck with fixed payments during slower periods.
"If your sales fluctuate (like most sellers), Onramp gives you cash when you need it, and breathing room when you don't." - Onramp Funds [41]
To ensure ad spend drives growth, tracking both TACoS and ACoS metrics is vital [13][39]. Seller Central dashboards offer real-time monitoring, while third-party tools can provide deeper insights into profitability.
Combining targeted budgeting, efficient ad optimization, and flexible financing creates a strong strategy to combat rising ad costs. Flexible financing solutions not only fill cash flow gaps but also protect investments in top-performing campaigns. Sellers positioned to scale successfully in 2026 will be those who pair strategic budgeting with precise optimization and adaptable financing. For a clearer picture of your financing needs, try the Onramp Funds calculator and build safeguards into your campaigns to avoid overspending.
FAQs
How can eCommerce sellers manage cash flow as Amazon advertising costs increase?
Rising Amazon ad costs can be a challenge, but with smart budgeting and ad spend optimization, sellers can stay ahead. Begin by keeping a close eye on metrics like ACoS (Advertising Cost of Sales) and TACoS (Total Advertising Cost of Sales). These numbers reveal whether your campaigns are profitable and where adjustments are needed.
Focus on high-performing areas by prioritizing high-converting keywords and fine-tuning your audience targeting. This approach minimizes wasted spending and ensures your budget is working harder for you.
During key moments like product launches or peak shopping seasons, consider reallocating your ad budget to maximize returns. Regularly review your campaigns to identify underperforming ads - pausing or adjusting them - and shift funds toward strategies that are driving results. Tools that track ad performance and automate bidding can also help you control costs while maintaining profitability.
By remaining data-focused and making continual tweaks, you can align your ad investments with your cash flow, paving the way for sustainable growth even as ad expenses climb.
How can I optimize my Amazon ad spend to improve ROI?
Boosting your ROI on Amazon ads comes down to smart, data-focused strategies that make every dollar count. Start by zeroing in on your top-performing campaigns and keywords. These are the ones driving the most profit, so it makes sense to allocate more of your budget there. At the same time, scale back spending on ads that aren’t delivering results.
Regularly revisit and tweak your bids and targeting settings. Why? Because your ad spend should always match up with your product margins and key performance indicators like ACoS (Advertising Cost of Sales). Staying on top of these adjustments helps ensure your campaigns remain efficient and profitable.
Take advantage of tools and automation to simplify campaign management. For example, Amazon’s budget rules and real-time bid adjustments are great for avoiding overspending while still maintaining visibility. Keep a close eye on metrics like ACoS and TACoS (Total Advertising Cost of Sales). These numbers can reveal areas where you can cut costs without hurting your sales.
By combining thoughtful planning, consistent optimizations, and careful performance tracking, you’ll be better equipped to manage ad costs and protect your profit margins.
How can revenue-based financing help Amazon sellers manage rising ad costs?
Revenue-based financing (RBF) offers a funding solution that adjusts to your business's sales performance. Instead of locking you into fixed monthly payments, RBF ties repayments to a percentage of your future sales. This setup means payments shrink during slower periods, easing cash flow strain - especially helpful when advertising costs rise or sales fluctuate.
For Amazon sellers, RBF can be a game-changer. It provides fast access to capital without requiring equity or collateral. This makes it ideal for managing costs during high-demand seasons like Prime Day or Q4. Whether you need funds for inventory, marketing, or operations, RBF aligns with your sales cycles, helping you scale efficiently while keeping profitability in focus in the ever-changing eCommerce world.
