

When products fail to sell, they drain resources and hurt your business. The big question: should you fix them or cut your losses? Here's how to decide:
- Fix: If issues stem from poor visibility, weak descriptions, or minor quality problems, improvements like better marketing, updated visuals, or optimized listings can help turn things around.
- Replace: If a product consistently loses money, is outdated, or fails to meet customer needs, it's time to move on. Sticking with it wastes time and money that could be better spent elsewhere.
Key metrics to assess performance:
- Conversion rate: Below 1–2% signals trouble.
- Add-to-cart rate: Less than 2% shows low purchase intent.
- Return rate: Over 20% indicates quality or description issues.
- Inventory turnover: Stock sitting for 180+ days incurs costs.
Fixing a product is often cheaper upfront and keeps loyal customers happy. However, it can take time and risks falling into the "sunk cost" trap. Replacing a product can resolve problems faster, offer new opportunities, and improve customer satisfaction - but it comes with higher upfront costs and risks.
Use the 50% Rule: If fixing costs more than 50% of the product's value, replacing it is usually smarter. Analyze the data, act decisively, and invest in products that truly drive your business forward.
Conversion Strategies for Maximizing ROI | eCommerce Tips
sbb-itb-d7b5115
How to Identify Low-Performing Products
Spotting underperforming products isn't just about glancing at sales numbers. While many sellers rely on intuition or simple sales reports, this approach often misses the hidden issues lurking in your product catalog. For instance, a product might generate revenue but eat into profits due to high return rates or steep advertising costs. Another might have great conversion rates but lack the visibility it needs to thrive.
To get the full picture, you have to dig deeper than total sales. Roughly 20% of a brand’s products typically account for 80% of its total sales [7]. This means a large chunk of your inventory might be underperforming, but not all for the same reasons. Some items might attract plenty of clicks but fail to make it into carts, while others sell once but never see repeat purchases. Understanding the reasons behind a product's failure is just as important as identifying the failure itself. This insight helps you focus on the right metrics.
Key Metrics to Track
Traditional ABC analysis groups products into A (top 80%), B (next 15%), and C (bottom 5%) categories based on revenue or margin [8]. While this can highlight your top earners, it doesn’t explain why some products struggle. As Dmitry Nekrasov, Founder of JetMetrics, explains:
"ABC analysis tells you which products made money, but says nothing about why some sell and others don't. It doesn't catch weak listings with strong potential" [5].
Instead, focus on metrics that uncover the root causes of underperformance:
- Conversion rate: Measures how effectively your product page and pricing turn visitors into buyers. If your rate is below 1–2%, there’s likely an issue, especially since the average eCommerce conversion rate is just over 3% [6].
- Add-to-cart rate: Tracks purchase intent. If fewer than 2% of viewers add the product to their cart, something on the page might be deterring them [5].
- Return rate: Reveals quality issues or misleading descriptions. A return rate above 20% means you’re losing profit, even if sales seem strong [5].
- Repeat purchase rate: Indicates long-term value. For replenishable goods, anything below 5% suggests customers aren’t coming back [5].
- Inventory turnover: Shows how quickly stock sells. Products sitting in storage for over 180 days may incur aged inventory fees [3].
- CAC/CLV ratio: Compares customer acquisition cost (CAC) to customer lifetime value (CLV). A ratio below 1.0 means you’re losing money on each customer [6].
- Cart abandonment rate: If your rate is significantly higher than the industry average of 70% [6], it could point to issues like unexpected shipping costs or a clunky checkout process.
Here’s a quick reference table for these metrics:
| Metric | What It Reveals | Red Flag Threshold |
|---|---|---|
| Conversion Rate | Effectiveness of product page and pricing | Below 1–2% [5][6] |
| Add-to-Cart Rate | Initial purchase intent and product appeal | Below 2% [5] |
| Return Rate | Product quality or description accuracy | Above 20% [5] |
| Repeat Purchase Rate | Long-term customer satisfaction | Below 5% for replenishable goods [5] |
| Inventory Turnover | Speed of stock movement | 180+ days in storage [3] |
| CAC/CLV Ratio | Profitability of customer acquisition | Less than 1.0 [6] |
These metrics help pinpoint whether a product needs improvement or replacement.
Methods for Finding Underperforming Products
To dig deeper, examine SKUs individually to uncover hidden issues. For example, some products might generate high revenue but suffer from thin margins due to high costs or excessive ad spend.
Funnel analysis is a powerful tool for identifying weak points. It tracks the journey from product views to add-to-cart actions and checkout completions [5]. A product with 10,000 views but only 150 add-to-cart actions (a 1.5% rate) could be a "Click Tease" - it grabs attention but fails to convert. On the flip side, "Hidden Gems" have high conversion rates but low visibility [5].
You can also use sentiment analysis tools to scan customer reviews for recurring complaints about quality or misleading descriptions [7]. This qualitative data complements your metrics, offering insights that numbers alone might miss. Look out for "Wishlist Darlings" - products where over 10% of viewers save the item but fewer than 1% actually purchase. These might benefit from price adjustments or better timing [5].
Other categories to monitor include:
- "Discount Addicts": Products where over 70% of sales involve discounts. These might struggle to sell at full price, eroding profit margins [5].
- "Overhyped": Items with high ratings (4.5+ stars) but return rates above 20% or repeat purchase rates below 3%. These indicate a gap between marketing promises and actual performance [5].
How to Fix Low-Performing Products
After pinpointing the products that aren't performing well and understanding the reasons behind their struggles, the next step is figuring out how to address the issues. Not every low-performing product needs to be abandoned. Often, problems like poor visibility, weak presentation, or inventory issues can be corrected without completely scrapping the product. The trick is identifying which challenges can be resolved efficiently.
Common Problems You Can Fix
Most struggling products fail for reasons unrelated to their quality. For instance, if a product requires more than six clicks to find, it’s likely to go unnoticed since the average visitor views only 5.4 pages per session [1]. These products can get lost in your catalog, even if they have the potential to sell well with better exposure.
Inventory issues are another common culprit. If an item is out of stock but customers can still attempt to add it to their cart, it leads to disappointment and lost sales [1]. The solution? Set up low-stock alerts based on sales velocity. For example, if you sell three units per day and restocking takes five days, trigger an alert when inventory drops to 15 units [1].
Poor visuals and weak descriptions can also hurt performance. Low-quality images or outdated photos make shoppers question the credibility of your store. As the Varyant team puts it:
"When photos look dated or messy, shoppers read it as risk. Risk of wasting money, risk of hassle, risk of disappointment" [9].
Incomplete or inaccurate product information is another major issue. In fact, 98% of shoppers abandon purchases due to missing or incorrect details, and 31% of returns happen because products were described inaccurately [11].
Expectation mismatches are another frequent problem. If your product photos or descriptions don’t reflect the current version - like showing outdated packaging or inaccurate colors - customers may feel misled. This drives returns and negative reviews, even if the product itself is fine [9]. Tackling these issues with targeted updates can make a big difference.
Ways to Improve Product Performance
Now that we’ve outlined the most common problems, let’s talk about how to fix them. Simple adjustments like improving images and optimizing listings can breathe new life into underperforming products [11][10].
Start by boosting visibility for products that are buried in your catalog. Feature them in curated collections such as "Gifts Under $50" or "Back to School Specials", and promote these groups on your high-traffic pages [1]. This approach gives overlooked products another chance without requiring major changes.
Next, update your visuals. Audit your product photos, prioritizing best-sellers and high-traffic pages with low conversion rates. Use natural lighting for photos and ensure that colors are accurate - not overly edited with filters [1][9]. Create a consistent "photo rulebook" with guidelines for lighting, cropping, and aspect ratios to ensure your images look professional across all platforms [9]. Include at least five images per product, showing various angles and close-ups of details. Remember, 83% of smartphone users say product images are critical when deciding to buy [11].
Optimize product listings by placing key terms at the beginning of titles to improve search rankings [11]. Use keyword tools like Ahrefs or SEMRush to find high-intent, long-tail phrases that align with what shoppers are searching for [11]. When writing descriptions, focus on how the product benefits the customer rather than just listing technical details. Use bullet points to organize information - this format performs 90% better than paragraphs [11].
Incorporate trust signals like star ratings, detailed reviews, and user-generated photos. Features like 360° product views can boost sales by 27%, and 73% of shoppers are more likely to buy after watching a product video [11]. If you don’t have many reviews, consider working with influencers through platforms like Shopify Collabs to generate social proof [10].
Lastly, improve technical performance. Even a one-second delay in page load time can reduce conversion rates by 7% [11]. Compress images using tools like TinyPNG and enable lazy loading to keep pages fast. Since mobile devices account for about 78% of retail traffic [10], ensure your "Add to Cart" button is always visible, even when scrolling. As Maria Bonello from SMAKK Studios explains:
"If your product description pushes the Add to Cart button below the bottom of the browser, it's time for a redesign" [10].
| Strategy Element | Actionable Fix | Expected Impact |
|---|---|---|
| Product Titles | Add keywords at the start; use long-tail phrases | Improved search visibility and clicks |
| Descriptions | Use bullet points; focus on customer benefits | 90% better performance; reduced bounce rates [11] |
| Images | High-quality (3000px), multiple angles, video | 73% higher likelihood of purchase with video [11] |
| Trust Signals | Add star ratings and customer-uploaded photos | 27% increase in conversions [11] |
| Technical | Compress images; enable lazy loading | Prevents 7% conversion loss per second of delay [11] |
When to Replace Low-Performing Products
Not every product can be salvaged. Sometimes, replacing an underperformer is the smarter move to maximize your return on investment. While adjustments and improvements can help in some cases, there are clear signs when cutting your losses is the better option.
Signs You Should Replace a Product
If a product is consistently losing money, it’s a major warning sign. For instance, any product that has been unprofitable for two or more years, without serving as a "loss leader" to boost other sales or brand loyalty, likely needs to go [2]. A negative gross profit margin is a strong indicator that no amount of tweaking will turn things around.
Another key factor is market obsolescence. As technology evolves, some products simply become irrelevant. Take the rise of electric vehicles in the U.S., which accounted for nearly 9% of total vehicle sales in Q3 of 2024 [2]. If your product can’t meet changing market demands, replacing it is often more cost-effective than trying to modernize it.
The opportunity cost of sticking with a failing product is often underestimated. Resources spent trying to fix something that’s not working could be better used on more profitable ventures. As Dion Utt, Product Manager at Test Double, wisely notes:
"The biggest waste isn't failure - it's waiting too long to walk away" [12].
Customer feedback is another crucial signal. If you’re seeing persistent complaints about quality or a low Net Promoter Score (NPS), it might be time to retire the product [2]. A good example is Research In Motion’s decision to move BlackBerry manufacturing to Taiwan to cut costs. The drop in product quality alienated loyal customers and sped up the brand’s decline [2].
One helpful approach is the "kill-or-commit" framework: Ask yourself, "If we weren’t already invested, would we build this product today?" If the answer is no, it’s probably time to move on [12].
Here’s a quick comparison to help you decide whether to fix or replace a product:
| Metric | Indicator to Fix | Indicator to Replace |
|---|---|---|
| Profitability | Temporary dip; high gross margin | Consistent loss; no "loss leader" value |
| Market Fit | Needs better visibility or descriptions | Obsolete technology; market trends shift |
| Customer Feedback | Specific, fixable feature requests | Low NPS; ongoing quality complaints |
Once you’ve decided to retire a product, the next step is to prepare for its replacement.
How to Launch New Products Successfully
After deciding to replace a product, launching its replacement requires careful planning. Start by clearing out discontinued inventory to free up resources and focus [15]. A good practice is to review your product lineup twice a year, identifying the bottom 20% of products that generate the least revenue or hold the most unsold stock [15].
Strategic inventory clearance is key. Avoid deep discounts that could harm your brand’s image. Instead, bundle slow-moving items with bestsellers - think 3-for-2 offers, BOGO deals, or curated gift sets [15]. Seasonal events like Black Friday or Easter are great opportunities to clear out old inventory with modest discounts (10–20%), rather than slashing prices permanently [15]. As Katie, Founder of Kalmer with Katie, puts it:
"A well-presented 'Last Chance' edit feels intentional, not like a panic sale, and helps you free up space, cash, and focus for your next collection" [15].
When discontinuing a product, archive it in your system (e.g., Shopify) and stop reordering immediately. This preserves historical data while preventing further stock buildup [15].
Before launching a new product, validate your ideas through market research. Talk to at least 20 potential customers to test your assumptions about their needs and preferences [13]. Tools like Google Trends can help you analyze demand and behavior across regions [2]. Success often comes from solving a specific customer problem. For instance, Google’s $3.2 billion acquisition of Nest in 2014 highlighted how focusing on practical benefits - like saving money and improving comfort - can outperform vague concepts like a "connected home" [4].
Early usability testing is another must. Have non-experts try your product before launch to catch issues like confusing setups or outdated features [4]. Make sure the product aligns with your company’s long-term goals to avoid creating "technology in search of a need" [4]. With failure rates for new products ranging from 40% to 80% [12], thorough validation is critical.
Finally, don’t overlook mobile optimization. By 2026, mobile eCommerce is expected to account for nearly 60% of all online sales [14]. With 1.65 billion people projected to shop via smartphones that year [14], ensuring your product pages are mobile-friendly from the start is non-negotiable.
Fix vs Replace: Comparing Your Options
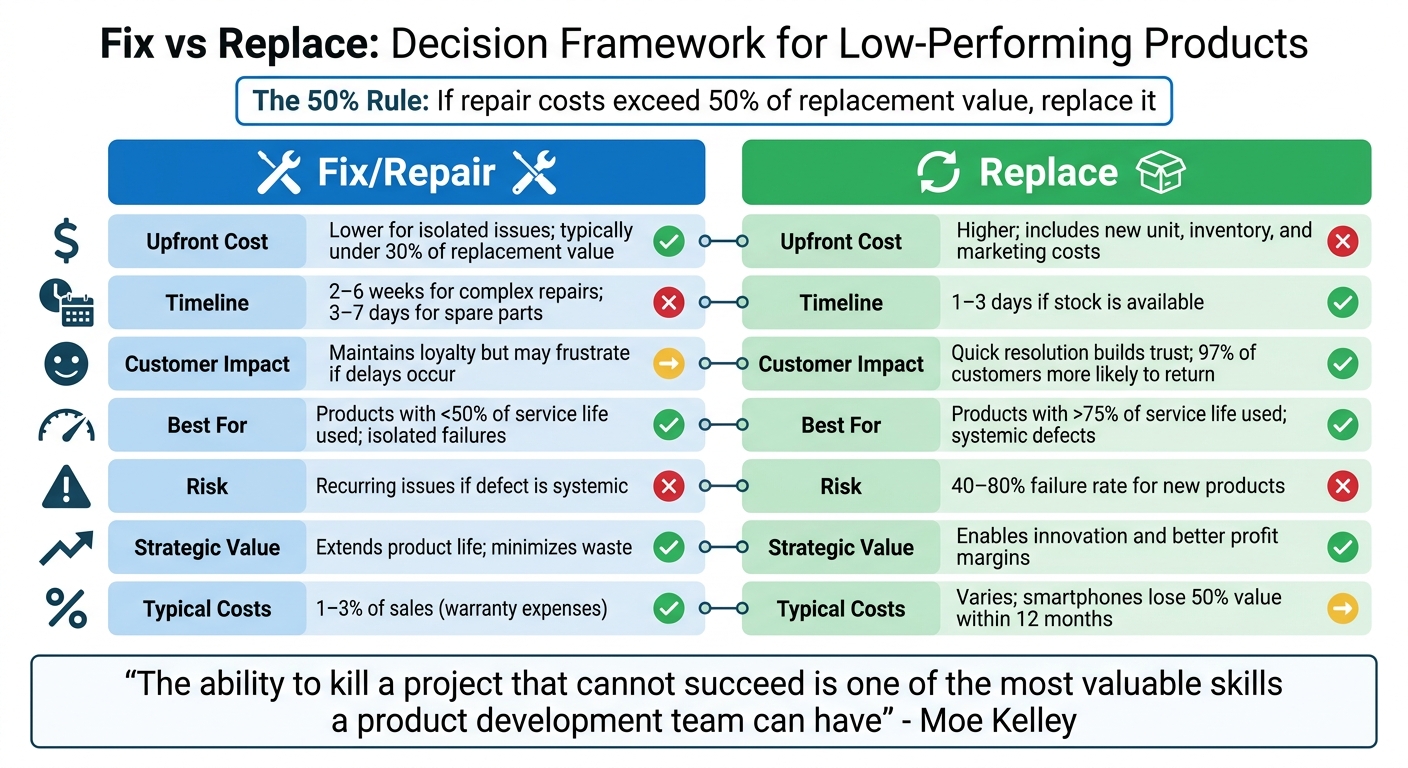
Fix vs Replace Low-Performing Products: Decision Framework
When deciding between fixing or replacing a product, the choice often comes down to economics, timing, and strategic alignment. Each option comes with its own benefits and challenges, and understanding these can help guide the best course of action.
Fixing a product can help maintain customer loyalty and preserve brand trust, especially when the issue is isolated. It’s often a cheaper option upfront, as repairs typically cost less than a full replacement [16][17]. However, repairs can take time - sometimes weeks for complicated issues - and require navigating logistical hurdles like sourcing parts and coordinating labor [16][18]. There’s also the risk of falling into the "sunk cost fallacy", where additional resources are poured into a product that may no longer be worth saving [18].
On the other hand, replacing a product tends to resolve issues faster and with greater customer satisfaction. In fact, 97% of shoppers report they’re more likely to return to a brand after a quick and positive resolution [16]. Replacement also opens the door to new features, improved performance, or better energy efficiency [16][17]. But it’s not without downsides - replacements come with higher upfront costs, potential inventory waste, and a 40%–80% risk of failure for new products [18].
A good rule of thumb is the 50% Rule: if repair costs exceed 50% of the product’s replacement value, replacement is usually the smarter choice financially [16][17]. This approach prioritizes return on investment, a critical factor in eCommerce operations. For safety-related defects or widespread design issues, replacement isn’t just practical - it’s non-negotiable [16][17]. As Moe Kelley, a Strategy and Innovation Consultant, puts it:
"The ability to kill a project that cannot succeed is one of the most valuable skills a product development team can have" [4].
Comparison Table: Fixing vs Replacing
Here’s a quick breakdown of how the two options stack up:
| Factor | Fixing/Repair | Replacing |
|---|---|---|
| Upfront Cost | Lower for isolated issues; typically under 30% of replacement value [17] | Higher; includes cost of new unit, inventory, and marketing [16] |
| Timeline | 2–6 weeks for complex repairs; 3–7 days for spare parts [16] | 1–3 days if stock is available [16] |
| Customer Impact | Maintains loyalty but may frustrate if delays occur [16] | Quick resolution builds trust; 97% of customers more likely to return [16] |
| Best For | Products with less than 50% of service life used; isolated failures [17] | Products with over 75% of service life used; systemic defects [17] |
| Risk | Recurring issues if the defect is systemic [18] | 40–80% failure rate for new products [18] |
| Strategic Value | Extends product life; minimizes waste [16][17] | Enables innovation and potential for better profit margins [17] |
| Typical Costs | 1–3% of sales (warranty expenses) [16] | Varies; for example, smartphones lose 50% of their value within 12 months [17] |
This comparison highlights the trade-offs between the two approaches, helping you weigh immediate costs against long-term benefits.
How to Decide: Fix or Replace?
Steps for Making the Right Decision
When deciding whether to fix or replace a product, start by understanding why the product is underperforming. Does it solve a clear customer need, or is it simply "technology in search of a need"? As Moe Kelley, a Strategy and Innovation Consultant, explains:
"If you can't point to the specific and glaring need you are solving for... then kill the product and start over" [4].
Next, weigh both hard and soft factors. Hard factors include features, production costs, and technical capabilities, while soft factors cover usability, aesthetics, brand perception, and customer experience. A product with great features can still fail if it's frustrating to use. External usability testing can often uncover issues that internal teams overlook.
Think about future market trends. If there's a risk your product will feel outdated soon after launch, replacing it might be the smarter move. Tesla, for instance, thrived by betting on advancements in battery technology and IT markets, rather than being constrained by existing limitations.
Finally, establish clear milestones. If fixing the product doesn’t meet specific success criteria within a set timeframe, it may be time to cut your losses. This approach not only clarifies the product’s future but also helps optimize your overall capital allocation.
Using Onramp Funds to Support Your Decision
Financial challenges can impact both fixing and replacing a product. Fixing a product often involves costs like materials, packaging updates, and marketing efforts. On the other hand, launching a new product demands upfront investments in inventory, supplier deposits, and promotional campaigns - often before generating any revenue.
That’s where Onramp Funds comes in. They provide equity-free financing tailored for eCommerce sellers facing these hurdles. With funding available in as little as 24 hours and repayments tied to a percentage of your sales, you can make necessary investments without putting undue pressure on your cash flow. The revenue-based model ensures that repayments adjust with your sales performance, offering flexibility if a new product takes longer to gain traction.
For sellers on platforms like Amazon, Shopify, Walmart Marketplace, and TikTok Shop, Onramp Funds integrates directly with your store to create customized funding solutions. Whether you need $10,000 to refine packaging and photography for a struggling product or $100,000 to launch a new product line, their flexible structure - featuring a fixed fee of 2–8% - provides a clear cost framework. This transparency helps you assess the ROI of your decision and align your strategy with measurable outcomes, ensuring your resources are used effectively.
Conclusion
Deciding whether to fix or replace a low-performing product comes down to analyzing the right data. Metrics like gross profit margin, conversion rates, and customer feedback are your compass. Without this focus, you risk falling into the trap of the sunk cost fallacy.
A failing product doesn’t just underperform - it drains resources and blocks better opportunities. Take Apple in 1997, for example. By cutting 70% of its product lineup and narrowing its focus to just four core products, the company didn’t just save resources - it paved the way for the innovations that redefined its future. This is a clear reminder that trimming the excess can sometimes be just as impactful as expanding.
The key lies in combining analytics with strategic action. Quantitative factors like production costs and profit margins need to work hand-in-hand with qualitative insights, such as usability, brand alignment, and market trends. Products with a clear market need but flawed execution are worth fixing. On the other hand, products that lack strategic fit or fail to solve real customer problems are better replaced. With 40%–80% of new products failing [12], the challenge is knowing which ones deserve another shot and which are holding your business back.
Capital allocation is another critical piece of the puzzle. Aligning your financing strategy with product decisions ensures that your business remains financially agile. Revenue-based financing, for example, offers a flexible option. Companies like Onramp Funds provide equity-free financing tailored for eCommerce businesses, with repayment plans that adjust based on your sales performance. This type of funding can help you execute your strategy without putting unnecessary strain on cash flow.
Ultimately, a strong product lineup is built on evidence-based decisions. Every product in your portfolio should serve a purpose - whether it’s driving profits, building customer loyalty, or creating cross-selling opportunities. Eliminate what doesn’t align with your strategy, double down on what does, and focus on what truly drives your business forward. By making thoughtful choices and optimizing your funding, you can ensure every product contributes to a stronger, more strategic portfolio.
FAQs
Which metrics should I prioritize to decide fix vs replace?
When you're faced with the choice to fix or replace a product that's not performing well, it's crucial to focus on profitability, market relevance, and customer feedback. Pay attention to key indicators like sales trends, customer satisfaction levels, and how well the product fits current market demands. If a product consistently falls short, doesn't address customer needs, or seems outdated in the market, it might make more sense to replace it altogether. By prioritizing these factors, you can ensure your resources are invested in products with stronger potential for growth.
How long should I try fixes before killing a product?
When deciding whether to repair or replace a product, it’s smart to weigh the cost and effort of fixing it against its value or the price of a replacement. A handy rule of thumb is the 50% rule: if repair costs are less than half the cost to replace, it’s usually worth fixing. Another approach is to set a specific timeframe or limit for repair attempts. Either way, it’s important to regularly assess whether continuing repairs is still financially sensible.
How can Onramp Funds help finance a fix or replacement?
Onramp Funds offers quick, equity-free funding designed to handle the costs of fixing or replacing underperforming products. This allows eCommerce businesses to better manage their cash flow while making the improvements needed to keep their operations running smoothly or even take them to the next level.
