

Managing inventory directly impacts your cash flow, profitability, and growth potential. Poor inventory decisions - whether overstocking or understocking - can lead to significant financial strain. Here’s what you need to know:
- Overstocking ties up cash in unsold products, storage fees, and insurance.
- Understocking results in missed sales and wasted marketing efforts.
- Supplier Minimum Order Quantities (MOQs) require upfront payments, creating cash flow challenges.
- Seasonal demand increases the need for careful planning to avoid cash shortages during peak sales periods.
Key strategies for managing inventory effectively include:
- Just-in-Time (JIT): Reduces excess stock and frees up cash.
- Economic Order Quantity (EOQ): Balances ordering and holding costs.
- ABC Analysis: Prioritizes high-value, fast-selling products.
Tracking metrics like inventory turnover, Days Inventory Outstanding (DIO), and carrying costs helps optimize inventory levels and cash flow. Flexible financing options, such as revenue-based financing, can bridge gaps between purchasing inventory and receiving sales revenue, ensuring your business stays on track.
Effective inventory strategies for enhanced cash flow
sbb-itb-d7b5115
Inventory Decisions That Impact Capital Requirements
Three key inventory decisions influence how much capital your eCommerce business needs at any given time. Each decision impacts cash flow and funding in its own way, building on the inventory-to-cash conversion themes discussed earlier.
Overstocking vs. Understocking: Finding the Right Balance
Overstocking ties up cash in excess inventory, storage costs, and insurance, while understocking results in lost sales and wasted marketing dollars spent on unavailable products. The numbers paint a clear picture: overstocks, stockouts, and preventable returns contribute to 11.7% of lost revenue for retailers[4]. On top of that, poor inventory decisions account for 53% of unplanned markdown costs[4].
"Poor inventory management ties up massive amounts of working capital in slow-moving or dead stock - overstocked deadweight. Meanwhile, you might struggle to order fast-selling items because your cash is locked up in products that won't move."
– Derek Hile, Stellar One[4]
Striking the right balance requires precise demand forecasting and regular monitoring of sales velocity by SKU. By identifying which products sell quickly and which linger, you can avoid tying up capital in slow-moving items while ensuring adequate stock of your top sellers. This balancing act becomes even trickier when supplier minimum order quantities (MOQs) come into play, adding another layer of complexity to cash flow management.
Minimum Order Quantity (MOQ) and Cash Flow Impact
Supplier MOQs often pose a significant challenge for eCommerce businesses. High MOQs force bulk purchases, draining cash reserves long before any revenue is generated.
The timing gap makes this issue worse. Suppliers frequently require payment 30 days or more before you see any revenue from those products[5]. While meeting high MOQs can unlock discounts of up to 20%, boosting margins, the large upfront cost can leave you short on liquidity to restock fast-selling products[5].
Paul Voge, Co-founder and CEO of Aura Bora, faced this exact challenge. His company used extended payment terms to bridge the gap between paying for inventory and receiving customer payments. This allowed them to fund inventory runs that traditional financing - often 10-20x lower - couldn’t support[5].
"Access to higher limits and extended payment terms enables us to keep up with inventory without straining our working capital."
– Paul Voge, Co-founder and CEO, Aura Bora[5]
Having cash readily available for upfront payments also strengthens your negotiating power. Suppliers may offer better pricing or prioritize your orders if you can pay immediately. Inventory financing can help meet MOQ demands while preserving your working capital. Similar timing issues arise with seasonal demand, where planning inventory investments around cash flow cycles becomes vital.
Seasonal Demand Changes: Planning for High and Low Periods
Seasonal businesses face dramatic swings in capital needs. You may need to invest heavily in inventory right before peak season - often when cash reserves are at their lowest after a slow period.
Take a toy seller, for example. They might place orders in July or August, even though sales won’t peak until November and December. This creates a 3-4 month gap where capital is tied up in inventory. To complicate matters, online return rates in 2024 hovered around 17%[4], meaning returned items further delay the availability of cash until they are processed and restocked.
Planning for these seasonal fluctuations starts with accurate sales forecasting. Use data from previous years, adjusted for growth trends and market changes, to calculate your peak inventory needs in dollar terms. Then, work backward to determine when financing must be secured. Many sellers underestimate their capital needs by failing to account for the delay between paying suppliers and receiving customer payments.
The global inventory financing market hit $205.7 billion in 2023[3], underscoring the widespread demand for external capital to bridge these seasonal gaps. Revenue-based financing can be especially helpful for seasonal businesses, as repayments scale with sales - higher during busy periods and lower during slower months.
Inventory Management Models for Better Capital Efficiency
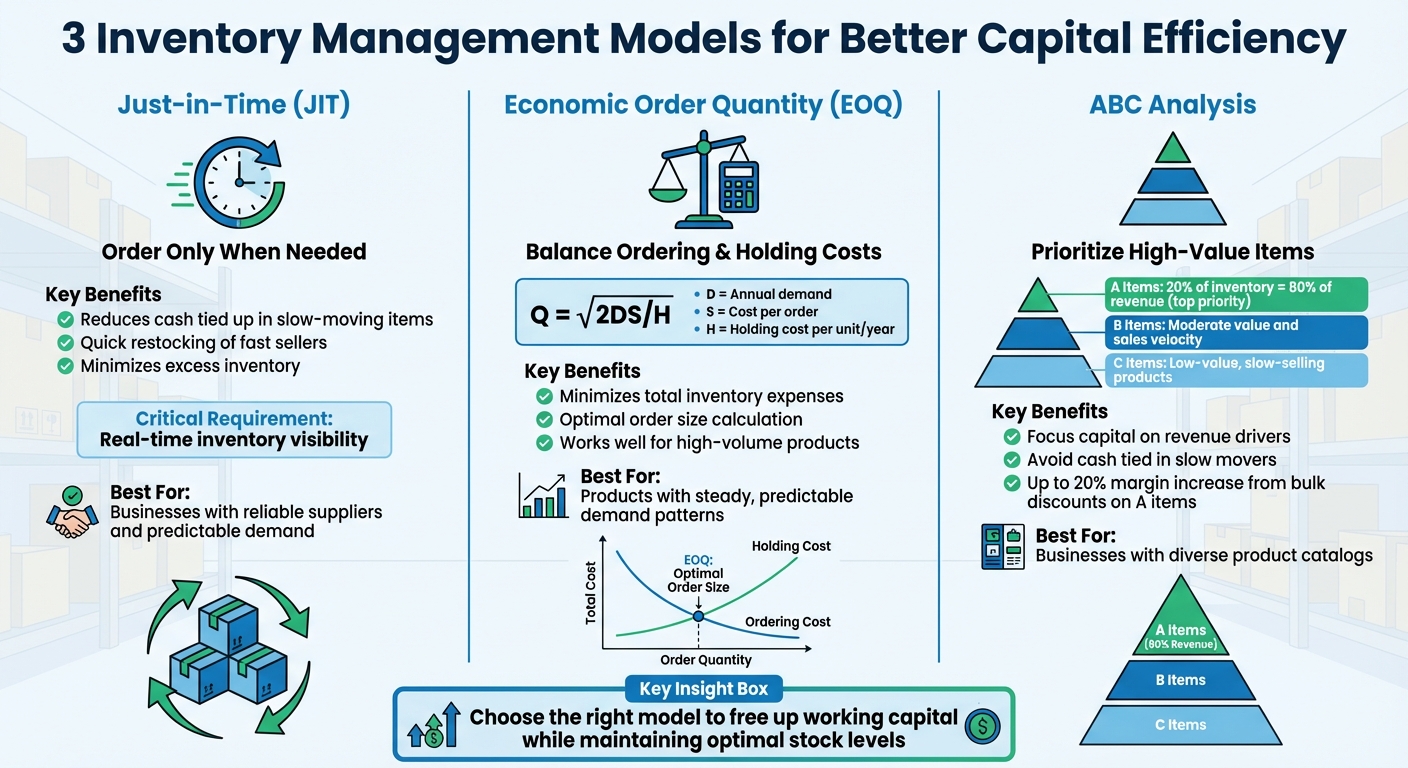
Inventory Management Models Comparison: JIT vs EOQ vs ABC Analysis
Choosing the right inventory management model can do more than just reduce excess stock - it directly tackles the capital challenges businesses often face. Instead of relying on guesswork to determine reorder points, these models free up working capital while ensuring you maintain the right stock levels. Below, we explore three approaches that turn inventory decisions into smart capital management strategies.
Just-in-Time (JIT) Inventory Management
The JIT model focuses on keeping inventory levels as low as possible by ordering stock only when it's needed. This approach reduces the risk of tying up cash in slow-moving items while helping you quickly restock fast-selling products. The secret to making JIT work is real-time inventory visibility. Without it, outdated data from manual processes or disconnected systems can lead to stockouts or overstocking. By integrating your inventory system with platforms for sales, accounting, and fulfillment, you create a centralized hub of accurate data. This ensures reorders are triggered based on actual sales trends. Additionally, aligning your capital access with real-time inventory tracking helps you avoid costly last-minute backorders or rush shipping fees.
Economic Order Quantity (EOQ) Model
The EOQ model is designed to strike a balance between ordering costs and holding costs, helping you calculate the ideal order size that minimizes overall inventory expenses. Ordering costs include things like shipping fees and administrative time, while holding costs cover storage, insurance, and the capital tied up in inventory. The EOQ formula is:
Q = √(2DS/H)
Where:
- D = Annual demand
- S = Cost per order
- H = Holding cost per unit per year
This model works particularly well for high-volume products with steady demand patterns[6]. However, it's less effective for items with seasonal or unpredictable demand. While many inventory management systems now include EOQ calculators, understanding the formula can help you decide when bulk ordering makes financial sense versus when it might lock up working capital unnecessarily.
ABC Analysis for Inventory Investment Priorities
ABC analysis organizes inventory into three categories based on value and sales performance:
- "A" items: These typically make up about 20% of your inventory but contribute roughly 80% of your revenue.
- "B" items: Mid-tier products with moderate value and sales velocity.
- "C" items: Low-value items that sell slowly and often take up too much storage space.
This method helps you avoid the trap of tying up cash in slow-moving stock while ensuring that your best sellers - your "A" items - get priority access to capital. Regular analysis at the SKU level can reveal which products deserve more investment and which should be discounted to free up space and funds. By focusing on your "A" items as revenue drivers, you can take advantage of bulk discounts (potentially increasing margins by up to 20%[5]) and allocate working capital more effectively.
These models provide actionable strategies for optimizing inventory and improving how you deploy capital. Next, we'll dive deeper into practical ways to apply them for maximum impact.
Metrics to Track Inventory Performance and Capital Impact
When it comes to managing inventory, keeping an eye on the right metrics can make all the difference in optimizing cash flow and maximizing revenue. These metrics help you understand how effectively your inventory decisions are translating into financial results. Let's break down three key metrics that directly link inventory management to your financial performance.
Inventory Turnover Ratio
The inventory turnover ratio tells you how often your stock is sold and replaced within a specific timeframe. A higher turnover rate is a good sign - it means your capital isn’t tied up in slow-moving products. To calculate this, divide your cost of goods sold (COGS) by your average inventory value. For instance, if your annual COGS is $500,000 and your average inventory is $100,000, your turnover ratio would be 5. This means your stock is cycling through five times a year. A low turnover ratio, on the other hand, can signal overstocking or pricing issues that need attention to free up working capital.
Days Inventory Outstanding (DIO)
Days Inventory Outstanding (DIO), also known as "Days on Hand", measures how long your current inventory will last based on demand. A high DIO could indicate that too much capital is locked in slow-moving products, which might be holding back growth. To calculate DIO, divide your average inventory by COGS and multiply by 365. For example, with $50,000 in inventory and an annual COGS of $600,000, your DIO would be about 30 days. Amazon Business emphasizes the importance of keeping an eye on this metric:
"Optimal days on hand indicate you're not tying up cash in slow movers. Monitoring slow-moving or dead stock helps prevent capital from sitting idle." [7]
Regularly reviewing DIO allows you to adjust your purchasing cycles and align inventory levels with upcoming promotions or seasonal demand surges.
Carrying Cost of Inventory
Carrying cost reflects all the expenses tied to holding unsold inventory. This includes storage, insurance, fulfillment, and even the opportunity cost of capital tied up in stock. It also factors in handling, taxes, and the risk of unsellable items. To calculate carrying cost, add up all the expenses related to holding inventory - like warehouse fees, spoilage, and insurance - and divide by your average inventory value. Conjura highlights the importance of understanding these costs:
"Inventory is cash. Overstock means capital tied up in slow-moving SKUs, higher storage and fulfillment costs, and increased discounting pressure." [1]
Don’t forget to include "landed costs", which cover freight, duties, and handling expenses, to get a full picture of the capital tied up in each product.
| Metric | What It Measures | Why It Matters for Capital |
|---|---|---|
| Inventory Turnover | How often stock cycles through | High turnover reduces idle capital in slow-moving goods [7] |
| Days on Hand (DIO) | How long current stock will last | Balances cash usage with stockout risks [7] |
| Carrying Cost | Total expense of holding inventory | Reveals the true cost of tied-up capital [2][1] |
Forecasting Tools and Methods for Better Inventory Decisions
Getting inventory forecasting right can unlock cash tied up in unsold stock while setting the stage for growth. Modern tools for forecasting have come a long way from basic spreadsheets, offering eCommerce businesses the means to predict demand with much greater precision.
Using Data Analytics for Demand Forecasting
The foundation of effective forecasting lies in clean, consolidated data from all sales channels. This includes platforms like Shopify, Amazon, wholesale orders, and even advertising data. According to research, 80% of business leaders believe data is critical for decision-making, while 73% say data-driven planning significantly reduces uncertainty [10]. However, mismatched SKU IDs across ERP systems, warehouses, and ad platforms can lead to errors in forecasts, making data standardization essential [10].
AI and machine learning tools are becoming indispensable for spotting patterns in historical sales data. These tools can adjust forecasts based on variables like ad spend, pricing changes, or seasonal trends [8]. Some platforms even analyze social media sentiment and news to anticipate shifts in demand [8]. John Carter, Principal Consultant at Proxima, highlights the potential of these technologies:
"The ability to ask these AI tools any question about your supply chain and receive actionable, informed responses - like your own personal analyst and advisor - is going to be a major game changer for savvy supply chain professionals in the coming years." [8]
To improve accuracy, focus on SKU-level and warehouse-specific data rather than relying on category averages, which can mask individual product trends [10]. For products with steady sales, use a 90-day rolling average to calculate daily demand. For items with growing popularity, a 30-day weighted average can better capture upward trends. Seasonal products require a look at the same period last year, adjusted for current growth rates [11]. For instance, if your business has grown 20% year-over-year, apply the same growth rate to your historical data for a more accurate forecast [9].
Armed with these insights, you can calculate precise safety stock levels and reorder points to safeguard your inventory against unexpected demand surges [11].
Safety Stock and Reorder Point Calculations
Once demand forecasts are in place, the next step is to translate them into reorder points - the inventory levels that signal when it’s time to place new orders. The formula is simple: multiply your average daily demand by your lead time (in days) and add safety stock [11]. Lead time includes everything from order placement to stock arrival, factoring in processing, shipping, and customs clearance [11].
Safety stock acts as a buffer against unexpected demand spikes or supply chain delays. To calculate it, multiply a service level factor (1.65 for 95%, 2.05 for 98%, or 2.33 for 99%), the standard deviation of demand, and the square root of the lead time [11]. Without this buffer, your reorder point only accounts for average scenarios, leaving you vulnerable to stockouts during high-demand weeks or shipping delays [11].
Many eCommerce businesses are moving away from static reorder points, which are typically reviewed quarterly, to dynamic ones that update daily or weekly based on rolling demand data [11]. This shift is particularly helpful for managing sudden demand spikes driven by viral trends on platforms like TikTok [10]. Setting secondary alerts at 120–130% of your reorder point can give your team extra time to act, especially for imports with long lead times. Additionally, calculating separate reorder points for each warehouse-SKU combination helps account for regional differences in demand and lead times [11].
Using Onramp Funds for Inventory Financing Needs
Even with careful planning, gaps often arise between purchasing inventory and receiving sales revenue. For instance, a supplier might require a minimum order quantity (MOQ) of $20,000 upfront, or preparing for the Q4 holiday rush could drain your working capital months before Black Friday sales start rolling in.
How Onramp Funds Supports Inventory Strategies
Onramp Funds offers a solution to these timing challenges through revenue-based financing tailored for eCommerce businesses. Unlike traditional bank loans - which can take over 30 days to approve and come with fixed monthly payments - Onramp provides capital advances in as little as 24 hours. These advances are based on your sales data from platforms like Shopify, Amazon, and TikTok Shop [12]. Repayments are tied directly to your daily sales, typically ranging from 5-15% of revenue. This flexible approach means that during slower sales periods, your repayment amount adjusts accordingly, avoiding the financial strain caused by fixed payments [13].
This financing model is a game-changer for inventory management. If a supplier's MOQ exceeds your available cash, Onramp enables you to secure the required funds within 24-48 hours - no collateral or equity needed [12]. For seasonal inventory planning, the advance allows you to stock up for peak demand without depleting cash reserves needed for daily operations. For example, a gadget seller used a $30,000 advance to meet a $20,000 MOQ. The inventory sold within 45 days, yielding a 2x return on investment, with repayments automatically adjusting to align with Black Friday sales [14].
To qualify, businesses need a minimum of $10,000 in monthly revenue over the past six months. Setup is quick - taking just five minutes via API integration - allowing for automated underwriting and approval within 24 hours [15]. There’s no need for credit checks or personal guarantees, as approval is based solely on your sales performance and cash flow trends.
Onramp Funds Financing Plans Comparison
Onramp Funds offers flexible financing plans to meet various inventory needs. Whether you’re expanding, meeting an MOQ, or preparing for seasonal demand, there’s an option for you:
- Custom Funding Offers: For businesses with $20,000+ monthly revenue, advances up to $500,000 are available. These are ideal for significant inventory expansions or launching new products.
- Fixed Fee Structure: Designed for one-time MOQ purchases, this plan charges a flat 10% fee, offering predictable costs and payment clarity.
- Revenue-Based Financing: Perfect for managing seasonal inventory cycles, this option adjusts repayments to your sales, with no upfront fees.
| Feature | Custom Funding Offers | Fixed Fee Structure | Revenue-Based Financing |
|---|---|---|---|
| Funding Speed | 24-72 hours | 48 hours | 24 hours |
| Repayment Flexibility | Negotiated terms | Fixed lump sum | 5-15% of daily sales |
| Minimum Revenue | $20,000/month | $10,000/month | $10,000/month |
| Cost Structure | Variable fee (8-12%) | Flat 10% fee | Percentage-based, no upfront cost |
| Ideal For | Large expansions, bulk orders | One-time MOQ needs | Seasonal inventory, variable demand |
For example, a Shopify electronics store used a $100,000 Revenue-Based advance to stock up for Prime Day. This enabled them to achieve 3.5x inventory turnover while repaying through a 10% share of daily sales. The flexible structure helped them avoid the cash flow issues that often accompany fixed loan payments during slower post-peak periods [16].
Conclusion
The way you manage your inventory has a direct impact on your business's financial health and growth potential. Every dollar tied up in stock that doesn’t sell quickly is a dollar unavailable for marketing, launching new products, or covering day-to-day expenses. Inventory management isn’t just about storage; it’s about keeping your cash flow healthy.
Effective inventory management starts with mastering the basics: tracking turnover ratios, setting accurate reorder points, and using tools like ABC analysis to prioritize spending. With inventory distortions costing the retail sector around $1.7 trillion annually [2], the importance of getting it right is obvious. Models like Just-in-Time (JIT) and Economic Order Quantity (EOQ) can help maintain high service levels - 95% to 98% - while cutting down on excess stock [2]. These strategies are essential for balancing operational efficiency with financial flexibility.
But even the best plans can face challenges. Supplier minimum order quantities, seasonal demand spikes, and growth opportunities often require upfront capital before revenue catches up. This is where flexible financing options, like revenue-based financing, come into play. With repayments that adjust according to your actual sales, this approach helps avoid the strain of fixed loan payments during slower periods.
Businesses that grow sustainably don’t just see inventory as a logistical concern - they treat it as a driver of growth [1]. They align stock levels with marketing efforts, leverage data analytics for forecasts with up to 90% accuracy [1], and secure financing that adapts to their sales cycles. Whether it’s meeting supplier minimums or preparing for peak seasons, having the right capital strategy ensures smooth cash flow and efficient inventory turnover.
Partner with Onramp Funds to keep your business moving forward. With 24-hour approvals, flexible repayments tied to your revenue, and no equity loss, Onramp Funds is built to support your eCommerce inventory needs.
FAQs
How do I choose between JIT, EOQ, and ABC analysis?
Choosing the right inventory management strategy - JIT (Just-in-Time), EOQ (Economic Order Quantity), or ABC analysis - depends on what matters most to your business and how your operations are set up.
- JIT aims to keep inventory as low as possible, cutting down on storage costs. But, it relies heavily on dependable suppliers to meet demand without delays.
- EOQ helps find the sweet spot between ordering costs and storage expenses, ensuring you maintain just the right stock levels without overordering.
- ABC analysis categorizes inventory based on value: high-priority items (A) get more focus, while less valuable items (C) are managed with less effort.
Many businesses mix and match these strategies, tailoring them to fit their cash flow and operational needs.
What’s the fastest way to set reorder points and safety stock?
The fastest way to establish reorder points and safety stock is by leveraging data-driven methods like demand forecasting and inventory control strategies. By forecasting at the SKU level, you can align your inventory with sales patterns more effectively. Techniques such as safety stock analysis and ABC analysis help pinpoint the ideal stock levels for different products. Additionally, real-time tracking and forecasting tools make the process smoother, ensuring you can meet customer demand without tying up resources in excess inventory.
When does revenue-based financing make sense for inventory buys?
Revenue-based financing works well for inventory purchases if your business has consistent and predictable sales. It provides a flexible way to scale inventory without straining your cash flow. This approach is particularly helpful during growth periods or seasonal demand surges, as it aligns funding with your revenue patterns and helps maintain financial stability.
