

Every 90 days, eCommerce businesses should reassess their funding strategies to stay aligned with fluctuating cash flow, inventory demands, and marketing expenses. Quarterly reviews help identify opportunities for growth, avoid cash shortages, and ensure financing terms remain cost-effective. Here's a quick breakdown:
- Cash Flow Monitoring: Link eCommerce platforms and bank accounts to track sales, expenses, and monthly revenue trends. Focus on metrics like 3-month trailing revenue to gauge funding eligibility and timing.
- Expense Analysis: Separate fixed and variable costs, calculate accurate landed costs (LCOGS), and monitor operating expenses to maintain profitability.
- Key Metrics: Keep an eye on the Cash Conversion Cycle (CCC), Contribution Margin, and Customer Acquisition Cost (CAC) Payback Period for efficient capital use.
- Financing Options: Evaluate fixed-fee vs. revenue-based repayment models. Fixed fees suit steady revenue, while revenue-based financing adjusts to seasonal sales patterns.
- Performance Metrics: Track net revenue, return rates, and profitability to ensure funding supports sustainable growth.
How to Prepare for Q4: Financial Planning for Ecommerce Success
sbb-itb-d7b5115
Review Your Cash Flow and Sales Performance
Start by linking your eCommerce platforms - like Amazon, Shopify, and eBay - along with your bank accounts. This connection allows you to sync live sales and transaction data, giving you a complete view of your cash flow [2][1]. Identify "valid months" where your revenue reaches at least $8,000. This threshold is often used by funding platforms to determine eligibility, so tracking it can help you understand your standing [2].
Your 3-month trailing average revenue plays a major role in determining your funding limits and terms. For example, hitting $12,000 per month can open up access to higher funding limits and more favorable terms [2]. Use connected bank data to project your daily cash balances, helping you spot when cash flow might tighten during the month [2]. Additionally, breaking down monthly revenue trends can help you identify timing issues and cash needs.
Track Monthly Revenue and Trends
Revenue trends can point out when and where additional capital is needed. Some sellers face "uneven demand cycles" that require a cash buffer, while others experience "strong cycles" that allow for aggressive inventory restocking [1]. By adopting this forward-thinking approach, you can address potential problems before they escalate.
A seasonality assessment is also key. If Q4 accounts for 40–50% of your annual revenue, you’ll need to plan for significant upfront investments in inventory and marketing months in advance [4]. Simulate how funding and expenses will affect your future cash balances to stay ahead [2].
Review Operating Expenses
Accurate tracking of expenses is essential for managing cash flow effectively. Separate your fixed costs from variable ones to improve cash planning. Using tools that automatically categorize your bank transactions can save time and provide better visibility into spending patterns [2]. You can also filter expenses by category or timeframe to see exactly where your money is going.
Make sure you calculate your landed cost of goods sold (LCOGS) accurately. This figure includes direct materials, labor, manufacturing overhead, freight-in, duties, and storage costs [5]. Underestimating LCOGS can lead to pricing issues and cash flow headaches. Before seeking growth funding, confirm that your landed costs and margins are accurate to ensure profitability during a funded sales cycle [1].
Once your expenses are clearly defined, shift your focus to the metrics that drive cash flow efficiency.
Use Key Metrics for Cash Flow Analysis
The Cash Conversion Cycle (CCC) measures how quickly cash spent on inventory turns into revenue. It’s calculated as: Days Inventory Outstanding + Days Sales Outstanding – Days Payable Outstanding [4][5]. A CCC between 0–30 days indicates efficient working capital management [4]. To improve this, consider negotiating extended payment terms with suppliers - moving from Net-30 to Net-60 - and using multiple payment processors to avoid settlement delays [4].
Another critical metric is your Contribution Margin, which is revenue minus all variable costs, including COGS, shipping, payment processing, returns, and ad spend [3][5]. Direct-to-consumer brands often aim for margins of 30–40% [3]. Even a campaign with a 4.5x ROAS can result in just a 7.8% effective margin after factoring in these costs [3].
"Most bootstrapped brands need to recover CAC within 30 to 60 days to stay cash-flow positive. But their actual payback period? Try 120+ days." - Amy Leffingwell, LinkedIn [3]
Keep a close eye on your CAC Payback Period, aiming for under 3 months if you’re scaling aggressively with self-funding [3]. Monitor traffic and conversion rates daily, check CAC trends and inventory alerts weekly, and analyze contribution margin and CAC payback monthly [3]. This regular cadence allows you to tackle issues early while they’re still manageable.
Reassess Onramp Funds Financing Options
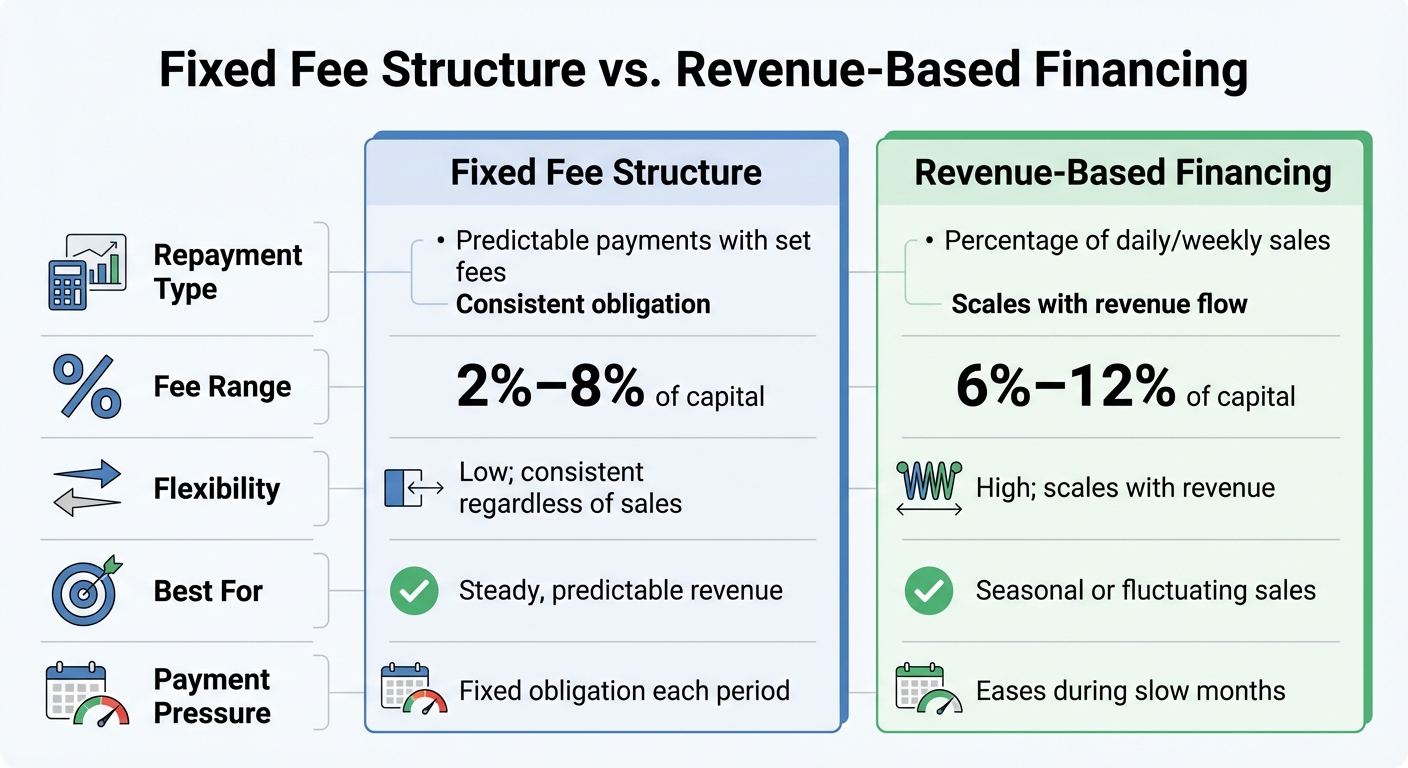
Fixed Fee vs Revenue-Based Financing Comparison for eCommerce
After examining your cash flow and business performance, it’s time to determine if your current financing setup still meets your needs. Onramp Funds provides tailored funding solutions specifically for eCommerce sellers generating at least $3,000 in monthly sales, with funds available as quickly as 24 hours after approval.
Custom Funding Offers Explained
Onramp Funds creates personalized funding offers by analyzing your connected sales data from platforms like Amazon, Shopify, BigCommerce, WooCommerce, Squarespace, Walmart Marketplace, and TikTok Shop. Unlike SBA loans, which can take 60–90 days to process, Onramp Funds delivers capital within 24 hours.
Their equity-free financing ensures you retain full ownership of your business while accessing the funds needed for growth. Funding amounts are based on your sales history and overall business performance, giving you the resources to scale without giving up equity. Once you’ve reviewed your funding offer, take a closer look at repayment options to find the best fit for your sales patterns.
Fixed Fee Structure vs. Revenue-Based Financing
The structure of your financing offer plays a big role in how flexible your repayment terms are. Onramp Funds offers two main repayment models, each catering to different business needs. The Fixed Fee Structure provides stability with predictable payments, charging a set fee between 2% and 8% of the funded amount. On the other hand, Revenue-Based Financing adjusts repayments based on your sales, offering more flexibility during slow months and scaling up during busier periods.
| Feature | Fixed Fee Structure | Revenue-Based Financing |
|---|---|---|
| Repayment Type | Predictable payments with set fees | Percentage of daily/weekly sales |
| Fee Range | 2%–8% of capital | 6%–12% of capital |
| Flexibility | Low; consistent regardless of sales | High; scales with revenue |
| Best For | Steady, predictable revenue | Seasonal or fluctuating sales |
| Payment Pressure | Fixed obligation each period | Eases during slow months |
Revenue-based financing is particularly useful for businesses with seasonal sales patterns. As Paul Voge, Co-founder and CEO of Aura Bora, shared:
"Access to higher limits and extended payment terms enables us to keep up with inventory without straining our working capital."
Before moving forward, take time to calculate whether your profit margins can comfortably cover the associated fees.
Match Financing to Your Business Goals
Choose a repayment model that aligns with the cash flow patterns you’ve identified. Clearly define how you’ll use the capital - whether it’s $50,000 to generate $150,000 in revenue or to fund a high-ROAS marketing campaign.
For businesses with fluctuating monthly revenue (e.g., $30,000 in November but only $8,000 in February), revenue-based financing can ease the burden of fixed payments during slower months. Meanwhile, businesses with steady revenue streams might save on overall costs with a fixed fee structure. Always calculate the total repayment, including fees, to understand the full cost of the financing. Onramp Funds’ funding calculator can help you estimate your offer based on current sales data. Use this tool to ensure the cost of financing aligns with your profit margins and growth goals.
Analyze Funding Performance Metrics
Evaluating performance metrics every 90 days helps ensure your funding strategy stays on track with your business goals. Beyond just monitoring cash flow, metrics like Net Revenue and Contribution Margin provide a clearer picture of how your funding impacts overall growth.
Once funding is secured, tracking these metrics helps determine whether your capital is fueling profitable growth or masking deeper issues. For instance, Net Revenue is far more telling than Gross Merchandise Value (GMV). Why? GMV doesn’t account for returns, discounts, or marketplace fees. Imagine a $100,000 GMV month that only translates to $75,000 in Net Revenue - that $25,000 gap could have serious implications for your ability to meet repayment obligations.
Key Metrics to Monitor
The Contribution Margin is a critical measure of whether your funding is driving sustainable growth. For example, if a campaign generates $50,000 in revenue but costs $55,000 in COGS and acquisition expenses, it’s a clear sign that the growth isn’t sustainable. Ideally, your contribution margin should exceed 40%. If it dips below 20%, it’s time to reassess your strategy.
Another essential metric is the CAC Payback Period (Customer Acquisition Cost). Check this quarterly - capital is being used effectively if payback occurs within six months. However, if it stretches beyond 12 months, your funding costs could jeopardize your long-term profitability. Similarly, aim for an LTV:CAC ratio of at least 3:1; a lower ratio suggests acquisition costs are eating into profits.
Keep a close eye on return rates, as they can significantly impact profitability. Typical return rates vary by industry - apparel ranges from 15–30%, footwear hits 20–35%, and home goods stay around 5–10%. High return rates can disrupt cash flow, forcing you to rely on more funding just to maintain operations. Monitor these rates monthly and compare them to your Net Revenue to catch potential issues early.
Use Dashboards and Accounting Tools
Integrating platforms like Shopify, Amazon, or Walmart Marketplace with accounting tools such as QuickBooks or Xero provides a real-time view of how funding impacts your finances. These tools sync daily sales data with your financial records, making it easier to see whether revenue-based repayments align with your cash flow. If you’re using Onramp Funds’ revenue-based financing, these integrations automatically adjust repayment amounts - higher during strong sales periods and lower during slower times - helping you preserve working capital.
Set up dashboards to track metrics like Repeat Customer Rate and Average Order Value (AOV) alongside your funding data. As Alex Schultz, Facebook’s VP of Growth, once said:
"If you can get 20-30% of customers coming back every month and making a purchase from your store, you should do pretty well."
Break these metrics down by channel - organic search, email, paid social - to identify which campaigns yield the best return. For example, a 4:1 Return on Ad Spend (ROAS) might seem impressive, but if your gross margins are only 25%, you could be breaking even or even losing money after factoring in capital costs. These insights are crucial for fine-tuning your quarterly funding strategy.
Adjust Your Funding Strategy for the Next 90 Days
After analyzing your recent performance, it’s time to tweak your funding strategy for the upcoming quarter. Timing doesn’t have to be perfect - being quick to adapt is often more important. Ecommerce revenue is rarely consistent, so your funding plan should be flexible enough to ride out the ups and downs.
Use the Onramp Funds Funding Calculator
The Onramp Funds funding calculator is a great tool to help you craft a funding plan tailored to your needs. By connecting your storefronts - like Amazon, Shopify, Walmart Marketplace, or TikTok Shop - the calculator uses your real-time sales data to create custom offers. Unlike traditional methods that rely heavily on credit scores, this approach considers your actual performance.
These offers often include fixed fee structures (typically 2–8%) or revenue-based financing options that match your cash flow patterns. Once you have these customized options, you can align them with your business cycles for maximum impact.
Align Funding with Business Cycles
To keep cash flow steady and support growth, it’s crucial to sync your funding with your business’s natural rhythms. For example, ecommerce businesses often experience predictable seasonal trends. Take Q4 - it can account for 25–40% of annual revenue for many sellers, which means significant upfront spending on inventory and advertising is often required.
For these high-demand periods, consider inventory financing to stock up and revenue-based financing to adjust repayment amounts based on sales. This way, your payments scale up during busy times and ease off during slower periods, helping you maintain working capital.
A 13-week forecast can help you identify when you’ll need extra capital. Planning a seasonal product launch? Secure funding early to cover manufacturing lead times and initial advertising costs. If you’re in the fashion industry, where return rates can hit 25–40%, include those returns in your cash flow planning to avoid shortages when refunds surge after the holidays.
Break the next 90 days into three phases:
- Days 1–30: Audit slow-moving SKUs to identify opportunities for improvement.
- Days 31–60: Renegotiate supplier terms to improve cost efficiency.
- Days 61–90: Optimize your marketing spend to maximize returns.
This structured approach keeps you ahead of the curve, ensuring your funding strategy evolves alongside your business needs every quarter.
Conclusion
Your funding strategy should evolve alongside your business. Nearly 90% of ecommerce companies fail within their first 120 days, with running out of cash being one of the top five reasons for failure [6]. This statistic highlights why treating funding decisions as fixed choices can lead to trouble. The fast-paced nature of ecommerce demands a strategy that adapts as quickly as market conditions change.
Reassessing funding every 90 days ensures your approach aligns with your business's shifting needs. The financing that worked when you launched your first product may no longer be sufficient as your business grows or during seasonal slowdowns. By linking your storefronts directly to Onramp Funds, you gain access to real-time, data-driven insights based on your actual sales performance. This allows your financing to adjust in step with your current needs.
Being able to make quick adjustments supports steady growth, whether you're gearing up for a busy season, introducing a new product line, or handling unexpected returns. Flexible financing tailored to your business cycles provides the stability needed to navigate these challenges and seize opportunities.
FAQs
What should I check in my numbers every 90 days?
Every three months, take time to review the critical financial and operational metrics that drive your eCommerce business. Start with a close look at cash flow performance - this means digging into receivables, payables, and overall liquidity to spot any red flags or opportunities. Check how well you're using funding sources, like credit lines or loans, to confirm they're meeting your business goals effectively.
Beyond finances, analyze sales trends and customer data to understand what's working and where you might need to pivot. Don't forget to measure operational efficiency: track inventory turnover and assess the return on ad spend (ROAS) for your marketing efforts. These insights will help you fine-tune your strategies and keep your business on a path toward steady growth and profitability.
How do I choose between fixed-fee and revenue-based repayments?
When choosing between fixed-fee and revenue-based repayments, think about how each aligns with your cash flow and growth plans. Fixed-fee repayments provide consistent, predictable payments, which can make budgeting easier. However, if your revenue varies, this option might end up being more expensive. On the other hand, revenue-based financing adjusts payments based on your income, offering more flexibility during slower sales periods. To decide, evaluate how stable your cash flow is and consider your growth projections to see which repayment method suits your business best.
How can I tell if my funding is actually profitable?
To figure out if your funding is working in your favor, focus on key financial metrics like gross profit margin, net profit margin, and cash flow. These numbers help you see whether your funding is fueling growth or simply covering expenses.
Another critical metric to watch is your cash conversion cycle (CCC), which measures how fast your funding translates into revenue. By reviewing these metrics regularly - ideally every 90 days - you can ensure your capital is being used effectively to boost profitability and drive business growth.
